Dashboard
Applicable editions: Faveo Helpdesk Community and Faveo Servicedesk Community
This gives an overview of the current status of the metrics and indicates the performance of an enterprise. It is consolidated and arranged on a single screen so the information can be monitored at a glance.
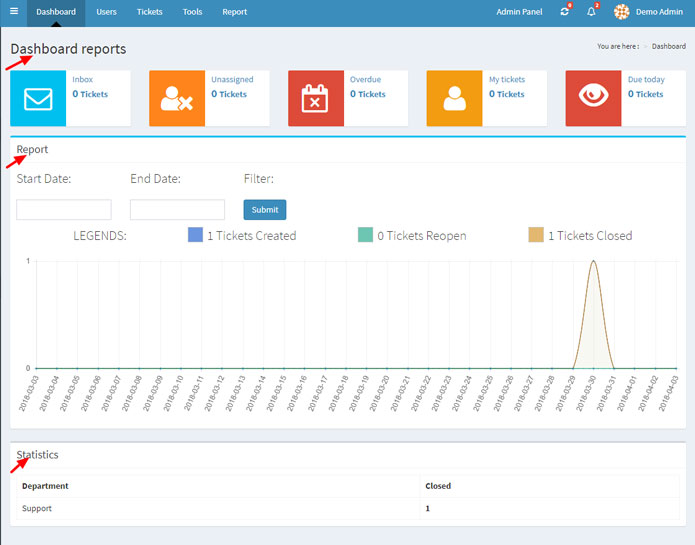
Dashboard Reports: gives you an overview of Inbox, Unassigned, Overdue, My tickets and Due today, where:
-
Inbox: Contains the new incoming tickets.
-
Unassigned: Agents can distribute the tickets amongst themselves based on the their department.
-
Overdue: Any ticket that is not resolved within the specified time, then the ticket will be tagged as overdue.
-
My tickets: This section contains the tickets that belong to a particular individual.
-
Due Today: It is often used to denote that a deadline to resolve the ticket is at hand.
Reports:
- Ticket summary metrics provides an overall number of tickets created, tickets reopened, tickets closed and tickets due.
- It generally the graph displays the number of tickets handled by the Helpdesk on monthly basis.
- But the report can be viewed for a day, week, month or years by entering the start date and end date.
For example, if your date range is from 2016/01/01 to 2016/01/01, the graph will display a single data point that is the summation of data from January 1 2016 through January 1 2017.
Statistics: This field tells us about the number of tickets that are closed, deleted, opened and resolved. You can view the status of the tickets according to the Departments, Agents and Teams. Also, you can use the Search field to view the status of the ticket of a particular department, agent or team.