Skip to content
New issue

Have a question about this project? Sign up for a free GitHub account to open an issue and contact its maintainers and the community.

By clicking “Sign up for GitHub”, you agree to our terms of service and privacy statement. We’ll occasionally send you account related emails.

Already on GitHub? Sign in to your account

Images in hover tags #1323

Closed
jackparmer opened this issue Jan 20, 2017 · 17 comments
Closed

Images in hover tags #1323

jackparmer opened this issue Jan 20, 2017 · 17 comments

Comments

@jackparmer
Copy link
Contributor

I have links to the PNG and SVG molecular structure diagrams for each of the points in this 3d scatter plot (each point represents a molecule):

image

It would be awesome if images could be configured to show up in hover text.

2 screenshots of this feature in Spotfire for illustration:

image

image

@johnpvaillancourt
Copy link

johnpvaillancourt commented May 11, 2017

I have the same requirement in a Plotly 3D scatterplot I'm working on in R, using plotly/htmlwidgets. Ideally, I'd like to be able to have an image attached directly to the hover box, for quick preview before opening a larger, external version for more in-depth inspection. Currently, I have images opening in separate windows by "plotly_click" on individual data points.

@chriddyp
Copy link
Member

Community question about this here: #1323

@jackparmer
Copy link
Contributor Author

jackparmer commented Mar 26, 2018

Community question (R): #9223

If any companies are able to fund this feature, please reach out.

@emmanuelle
Copy link
Contributor

Community question in https://community.plotly.com/t/how-to-create-customised-hovers-in-plotly/36815

@emmanuelle
Copy link
Contributor

Mentioned in the forum https://community.plotly.com/t/graph-hover-feature/40421/2.

@jackparmer
Copy link
Contributor Author

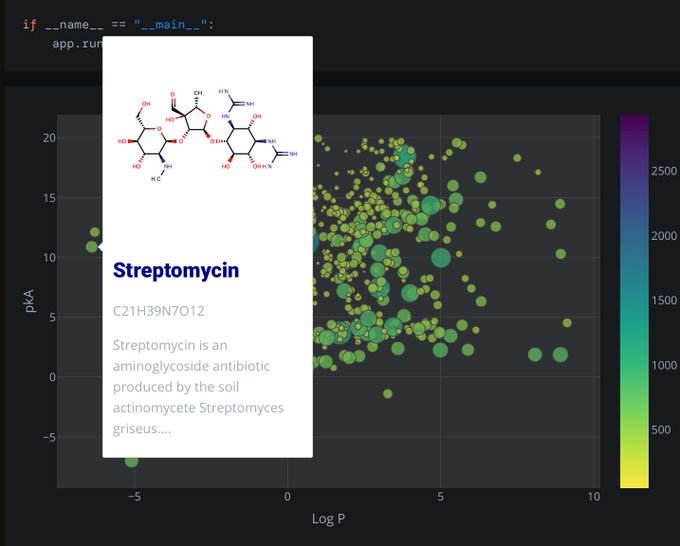
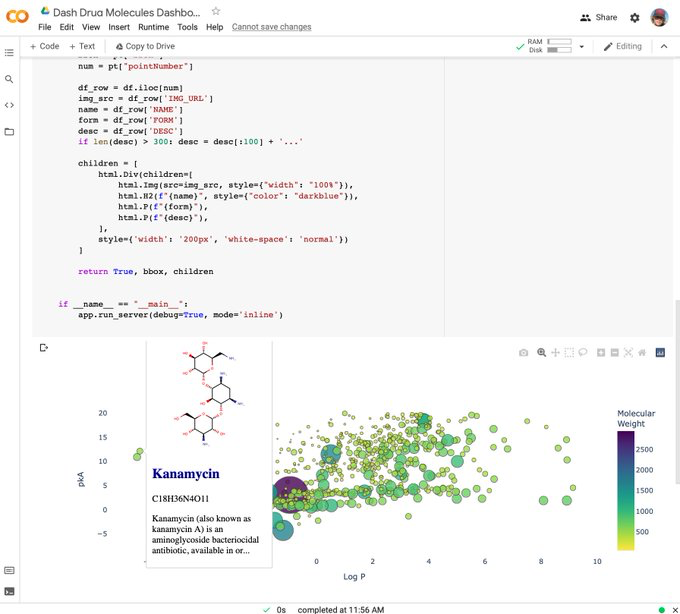
For visitors who are discovering this issue for the particular use case of displaying a molecular structure on hover, they may find these Dash molecule renderers useful in the meantime:

2d - https://dash.plotly.com/dash-bio/molecule2dviewer
3d - https://dash.plotly.com/dash-bio/molecule3dviewer
3d with ambient occlusion - https://dash.plotly.com/dash-bio/speck
3d based on NGL - plotly/dash-bio#496

@drscotthawley
Copy link

drscotthawley commented Mar 27, 2021

Four years and still open. :'-( I love the text annotation hover, & figured there's GOTTA be image annotation hover in a slick pro package like Plotly! ;-) Sadly I don't have molecular diagrams, just regular images.
Will keep a watch on @rreusser 's fork!

EDIT: Looks like Bokeh can do something along these lines -- even in Colab when used in concert with the nice package for Colab called kora. However the images must be hosted elsewhere -- bit of a wrinkle, that. For those interested, here is a demo notebook I made.

@zadamg
Copy link

zadamg commented Jun 9, 2021

Someday I will be able to put an image or picture into a plotly chart's hoverover.

It will be a great day. Today though, I am sad to see no progress thus far :*(.

@daviguima
Copy link

BUMP! That would be a great addition to my time-series analysis. Currently it is a pain to have several plots in parallel to inspect what is happening inside my simple px.line plot. But I know this is probably no trivial task at all, if it was, it would certainly be fixed already. Regardless of that, thanks for the great work you guys are doing behind the scenes in plotly (-:

@raphaeljolivet
Copy link

raphaeljolivet commented Jul 13, 2021

Hi, I needed the same, so I wrote a simple function to do it and posted in to this gist:
https://gist.github.com/raphaeljolivet/f076256e589f67c028a6bffaab279601

Example usage (assuming your images are stored locally) :

plot = xp.scatter(df, "nb_x", "nb_y")
template="<img src='./img/{id}.png'>"
interactive_plot(df, plot, template)

Output :
125475967-ef765d0a-2bd0-4aa8-b97b-fe3aaf708fa0

@drscotthawley
Copy link

@raphaeljolivet This is great.
And if the images are hosted on Colab, I wrote a routine to generate URLs for thumbnails of the images (requires the user to respond to a Google authentication prompt first):

https://github.com/drscotthawley/mrspuff/blob/master/mrspuff/scrape.py#L133

(!pip install mrspuff)

@jackparmer
Copy link
Contributor Author

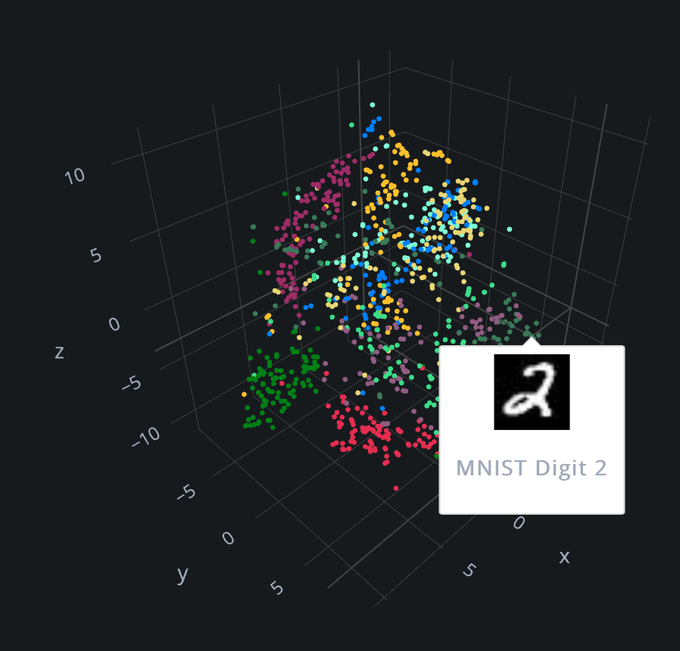
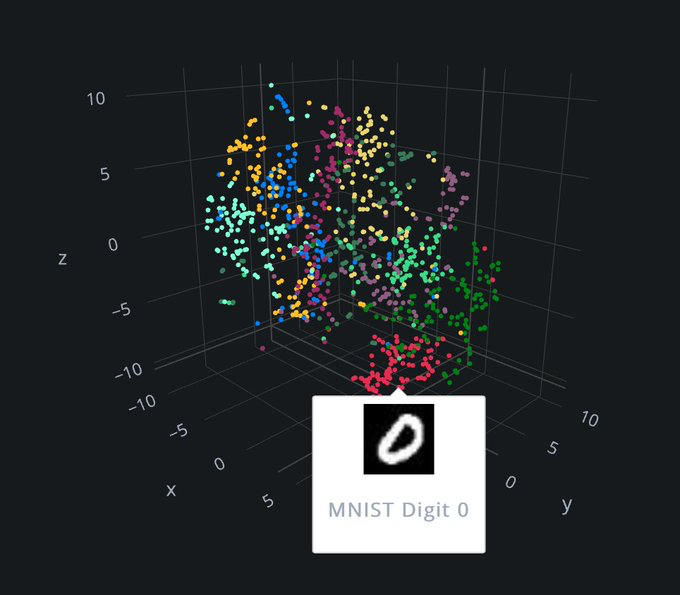
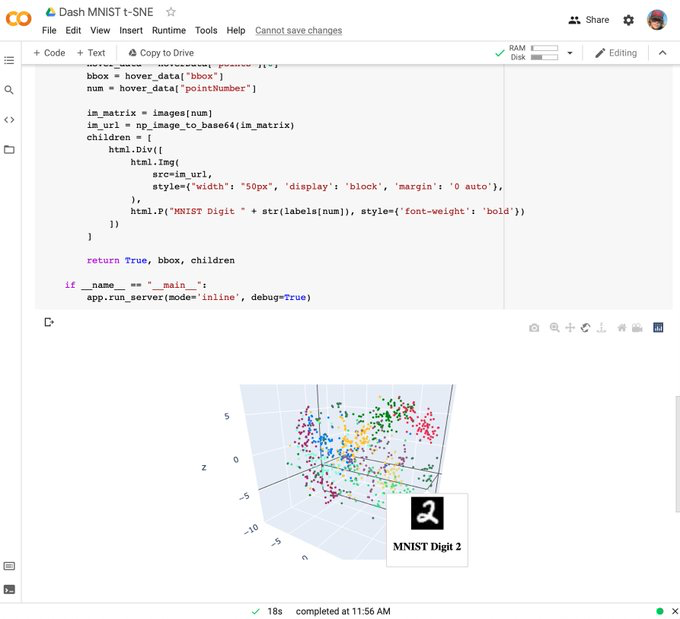
Images on hover is now finally available. Thank you everyone for your patience while we got this right and up to Plotly standards.

Huge thanks to @rreusser for getting the ball rolling.

Docs:
https://dash.plotly.com/dash-core-components/tooltip

Jupyter notebooks example 1:
https://colab.research.google.com/drive/1xUDTAK6NkzsLAYelCBMjpB09LjeI-faU?usp=sharing

Jupyter notebooks example 2:
https://colab.research.google.com/drive/1nSGnnlt_dwNFDNxCMIuDxk-AsujIdncP?usp=sharing

Screenshots!

image

image

image

image

image

If you like this feature, please give it a retweet here to help get the word out:
https://twitter.com/plotlygraphs/status/1445054301991211023

@drscotthawley
Copy link

@jackparmer This is great! Is it only available via Dash, or also via Graph Objects?
( e.g. https://plotly.com/python/graph-objects/tooltip 404's)

@jackparmer
Copy link
Contributor Author

jackparmer commented Oct 4, 2021 via email

@Jmegan042
Copy link

Quick question about exporting this as an HTML - put simply: I haven't figured out how to do this. I can export the app using the tips from the plotly dash docs - and clicking the download button I create, but the resulting figure doesn't contain any of the hover information when I do.

I understand that this may be due to the way we update the app, but I was wondering if there was an idea of how to bypass this?

@Farshudsor
Copy link

Quick question about exporting this as an HTML - put simply: I haven't figured out how to do this. I can export the app using the tips from the plotly dash docs - and clicking the download button I create, but the resulting figure doesn't contain any of the hover information when I do.

I understand that this may be due to the way we update the app, but I was wondering if there was an idea of how to bypass this?

Also interested in figuring out how to export the interactive plot to HTML. as @Jmegan042 mentioned, the exported figures do not have any hover information.

@roel-heremans
Copy link

roel-heremans commented Nov 5, 2023

Thank you for the examples that show figures on hovering over. I am creating a sunburst plot and would like to show png figures when hovering over a sector of the plot. I was creating the following code already but when i hover over i do get a super long string to be displayed rather than my png figure.

The code i have so far is the following:

`def create_scr_sunburst_figure_hierarchy(sunburst_data, which):
res = []
for hierarchy, mape, mdape, mape_std, mdape_std in sunburst_data:
h_split = hierarchy.split("_")
res.append(h_split + [mape])

df = pd.DataFrame(res, columns=['Line', 'Group', 'Subgroup', 'mape'])

# Create a Sunburst figure
fig = px.sunburst(df, path=['Line', 'Group', 'Subgroup'], values='mape',
                  color='mape', color_continuous_scale='rdbu')

# Function to load the PNG file for a sector
def load_png_for_sector(hierarchy):
    # Define the filename for the PNG
    pre_fix = 'SCR_Regression (M. Chain)_'
    post_fix = '_Q0_scf_v2_neutral.png'
    pre_fix = 'fig'
    post_fix = '.png'
    filename = os.path.join('plots', 'SCR', 'Regression', 'all_pngs',
                            f'{pre_fix}{hierarchy}{post_fix}')
    # Check if the file exists
    if os.path.exists(filename):
        # Read the PNG file and convert it to base64
        with Image.open(filename) as img:
            img = img.resize((100, 100))  # Resize to an appropriate dimension
            with img as img_data:
                img_data = img_data.tobytes()
                encoded_image = base64.b64encode(img_data).decode()
            # Create an HTML image tag to display the PNG in the hover
            return f'<img src="data:image/png;base64,{encoded_image}" width="200" height="200">'  # Adjust width and height as needed
            # return f'<img src="data:image/png;base64,{encoded_image}">'
    else:
        return "No image available"

# Update the hovertemplate to include the image
fig.update_traces(hovertemplate='<b>%{label}</b><br>Parent: %{parent}<br>MAPE: %{value}<br>%{customdata}',
                  customdata=df.apply(lambda row: load_png_for_sector('_'.join(row[:3])), axis=1))

# Show the figure
fig.show()

# Save the figure as an HTML file
fig.write_html(os.path.join('plotly', f'sunburst_{which}.html'))

if name == 'main':

    sunburst_data = [
    ("Sector1_Subsector1_Category1", 0.1, 0.2, 0.3, 0.4),
    ("Sector1_Subsector2_Category1", 0.2, 0.3, 0.4, 0.5),
    # Add more data
    ]
    create_scr_sunburst_figure_hierarchy(sunburst_data, "example")`

When i hover over one of the sectors i do get a long string not a figure. ALthough when i save the information
from the return statement f'<img src="data:image/png;base64,{encoded_image}" width="200" height="200">' in a file and open that html file in a browser i do see the correct png.
Does anyone can help me out.

Sign up for free to join this conversation on GitHub. Already have an account? Sign in to comment
Projects
None yet
Development

No branches or pull requests