-
Notifications
You must be signed in to change notification settings - Fork 2
Overview
This page focuses on the features presented by flowR and how to use them. If you have never used flowR before, please refer to the setup wiki page first, for instructions on how to install flowR.
flowchart TD
   root([<i>flowR</i>])

   root --> slice(<b>slicer</b>)
   subgraph " "
   slice --> rb(R bridge)
   slice --> norm(normalize)
   slice --> da(dataflow analyzer)
   slice --> rc(reconstruct)
   core(core)
   end
   root --> core(core)
   root --> benchmark(benchmark)
   root --> stat(statistics)
   root --> utility(utility)

   style utility stroke-dasharray: 5 5,opacity:0.5;

   click root href "https://github.com/flowr-analysis/flowr/" "Jump to the Repository"
   click rb href "https://github.com/flowr-analysis/flowr/tree/main/src/r-bridge/shell.ts" "Jump to the Implementation"
   click norm href "https://github.com/flowr-analysis/flowr/tree/main/src/r-bridge/lang%3A4.x/ast/parser/xml" "Jump to the Implementation"
   click da href "https://github.com/flowr-analysis/flowr/tree/main/src/dataflow" "Jump to the Implementation"
   click slice href "https://github.com/flowr-analysis/flowr/tree/main/src/slicing" "Jump to the Implementation"
   click rc href "https://github.com/flowr-analysis/flowr/blob/main/src/reconstruct/reconstruct.ts" "Jump to the Implementation"
   click core href "https://github.com/flowr-analysis/flowr/blob/main/src/core" "Jump to the Implementation"
   click benchmark href "https://github.com/flowr-analysis/flowr/tree/main/benchmark/src" "Jump to the Implementation"
   click stat href "https://github.com/flowr-analysis/flowr/tree/main/statistics/src" "Jump to the Implementation"
   click utility href "https://github.com/flowr-analysis/flowr/tree/main/src/util" "Jump to the Implementation"
The mermaid diagram above presents the architecture of flowR, with the important components directly related to the actual slicing highlighted accordingly (all boxes should be hyperlinks to the corresponding implementation if you are interested - depending on your browser, you may have to specifically open them in a new tab).
Primarily, flowR provides a backward program slicer for the R programming language, which is available with the corresponding slicer module and exposed by the slicer script.
Its subcomponents (like the custom R bridge or the static dataflow analysis) are not important if you simply wish to use flowR.
The benchmark module is only of interest if you want to benchmark/measure the runtime performance and reduction of the slicer. It is available with the benchmark script.
The statistics module is mostly independent of the slicer and can be used to analyze R files regarding their use of function definitions, assignments, and more. It is used to identify common patterns in R code and is available with the statistics script.
The core module contains flowR's read-eval-print loop (REPL) and flowR's server. Furthermore, it contains the root definitions of how flowR slices (see the interface wiki page for more information).
The utility module is of no further interest for the usage of flowR
The following sections explain how to use these features.
flowR itself has two main ways to operate:
- as a server which processes analysis and slicing requests (
--serveroption) - as a read-eval-print loop (REPL) that can be accessed directly from the command line (default option)
Besides these, there is a Visual Studio Code extension that allows you to use flowR directly from within the editor.
🐳️ If you use the docker-version, simply starting the docker container in interactive mode drops you right into the REPL (docker run -it --rm eagleoutice/flowr:latest), while launching with the --server argument starts the server (docker run -it --rm eagleoutice/flowr:latest --server).
⚒️ If you compile the flowR sources yourself, you can access flowR by first building the sources (npm run build) and executing then the root script (node dist/src/flowr.js).
Independent of your way of launching flowr, we will write simply flowr for either (🐳️) docker run -it --rm eagleoutice/flowr:latest or (⚒️) node dist/src/flowr.js. See the setup wiki page for more information on how to get flowR running.
Once you launched flowR, you should see a small R> prompt. Use :help to receive instructions on how to use the REPL and what features are available (most prominently, you can access all scripts simply by adding a colon before them).
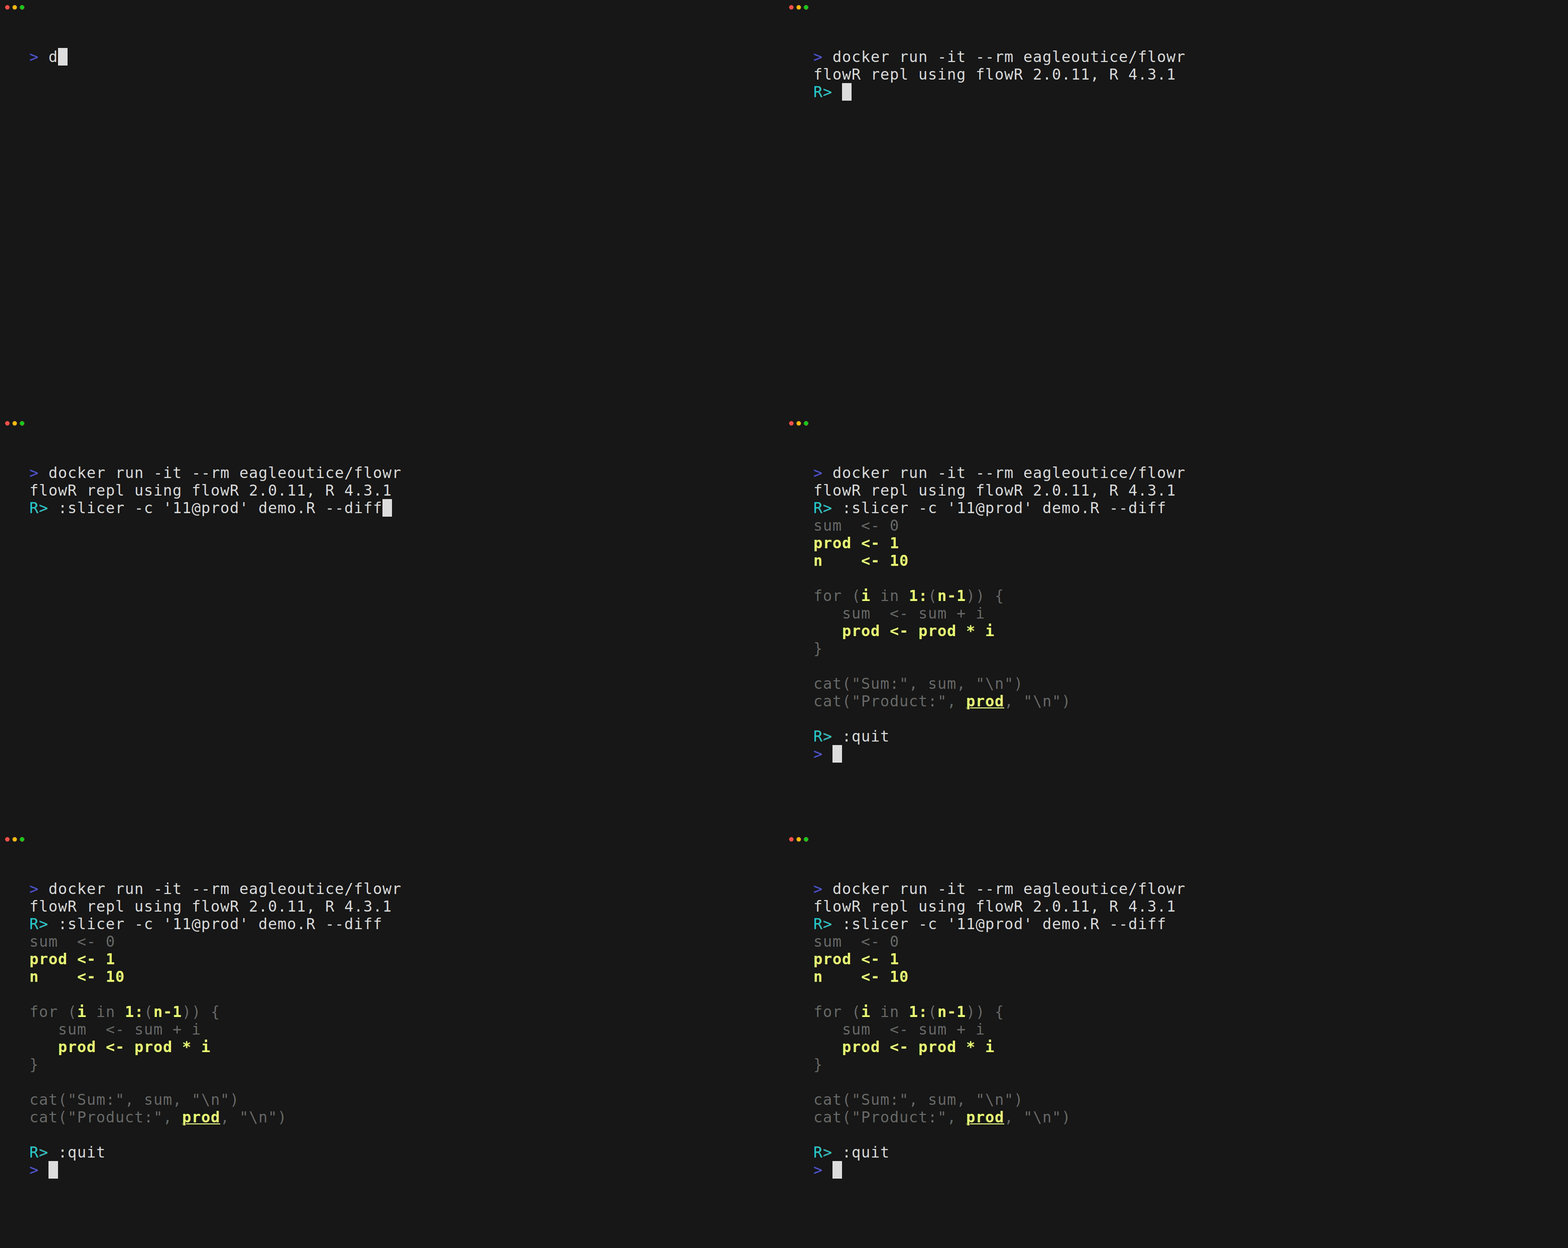
In general, all commands start with a colon (:), everything else is interpreted as a R expression which is directly evaluated by the underlying R shell (however, due to security concerns, you need to start flowR with --r-session-access to allow this). The following GIF showcases a simple example session:

Instead of the REPL, you can start flowR in "(TCP) server-mode" using flowr --server (write flowr --help to find out more). Together with the server option, you can configure the port with --port.
The supported requests are documented alongside the internal documentation, see the Interface wiki page for more information.
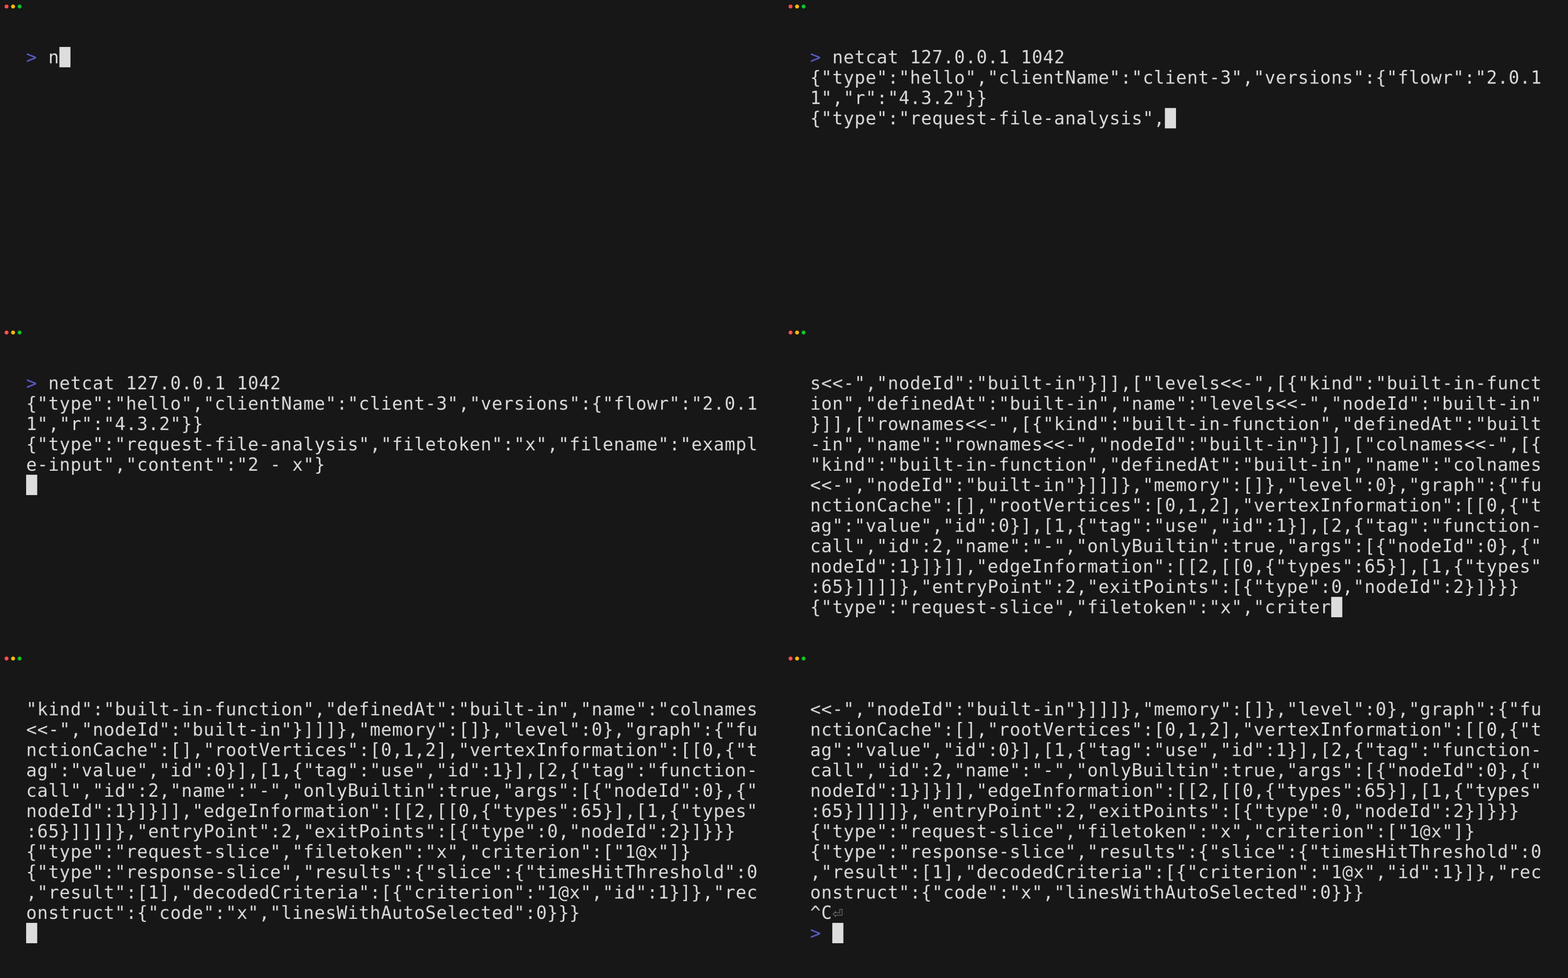
Small demonstration using netcat

Used vhs code
Output demo.gif

Set FontSize 40
Set Width 1800
Set Height 750
Set WindowBar Colorful
Set TypingSpeed 0.05s
Set CursorBlink true

Type "netcat 127.0.0.1 1042"
Sleep 200ms
Enter
Sleep 600ms

Type '{"type":"request-file-analysis","filetoken":"x","filename":"example-input","content":"2 - x"}'
Sleep 200ms
Enter
Sleep 2s

Type '{"type":"request-slice","filetoken":"x","criterion":["1@x"]}'
Sleep 200ms
Enter
Sleep 8s

Ctrl+C
Sleep 200ms
The server allows accessing the REPL as well (see the interface wiki page for more information).
This describes the old way of using flowR by creating and calling the respective scripts directly. Although this is no longer necessary, the scripts still remain, fully integrated into the REPL of flowR (you can access them simply by adding a colon : before the name).
To generate a slice, you need to provide two things:
- A slicing criterion: the location of a single variable or several variables of interest to slice for, like "
12@product" - The path to an R file that should be sliced.
For example, from the cli directory, you can run
npm run slicer -- --criterion "12@product" "test/testfiles/example.R"This slices for the first use of the variable product in line 12 of the source file at test/testfiles/example.R (see the slicing criterion definition for more information).
By default, the resulting slice is output to the standard output.
For more options, run the following from the cli directory:
npm run slicer -- --helpNow, the following alternative is to be preferred:
flowr -e ":slicer --help"Within the original thesis, I conducted a benchmark of the slicer, measuring:
- The required time of each step of the slicing process, and
- The achieved reductions in the size of the slice.
The corresponding benchmark script ultimately allows doing the same thing as the slicing script, but 1) parallel for many files and 2) for a wider selection of slicing points. By default, it starts by collecting all variables in a script, producing a slice for each of them.
For example, to run the benchmark on 500 randomly picked files of the folder <folder> using 8 threads and writing the output to <output.json>, you can run this from the cli directory:
npm run benchmark -- --limit 500 --parallel 8 --output "<output.json>" "<folder>"For more options, run the following from the cli directory:
npm run benchmark -- --helpThe resulting JSON file can be rather larger (starting off with a couple of hundred megabytes). Therefore, you probably want to summarize the results of the benchmark.
For this, you can make use of the summarizer script from within the cli directory like this:
npm run summarizer -- "<output.json>"Please note that the summarizer may require a long time as it parses, normalizes, and analyzes each slice produced, to calculate the reduction numbers. Therefore, it actually executes two steps:
- For each file, it calculates the reduction, required time, and other information, written to
<output-summary.json> - Calculate the "ultimate" summary by aggregating the intermediate results for each file
As the ultimate summary is much quicker, you can re-run it by specifically adding the --ultimate-only flag (although this is only really of use if you modify what should be summarized within the source code of flowR).
For more options, run the following from the cli directory:
npm run summarizer -- --helpIf you want to reproduce the statistics as presented in my master's thesis, see the corresponding wiki page.
For more information, run the following from the cli directory:
npm run stats -- --helpIf you know what the RDF N-Quads refer to, then you are good to go! If not, you do not have to worry - you probably do not need them (they are for a graph search that is based on flowR).
For more information, run the following from the cli directory:
npm run export-quads -- --help