L2 L3 MEM traffic on Intel Skylake SP CascadeLake SP
Intel introduced with Intel Skylake SP (and the successor Cascadelake SP) a change in the cache hierarchy. The sizes of each layer are changed (L2 larger, L3 smaller) and the L3 is now a victim cache (non-inclusive cache). This results also in a different approach to measure the traffic between L2, L3 and memory.
On this page, we show how to improve the measurments of L2, L3 and memory traffic for Intel systems with L3 victim caches. We test different hardware performance events in order to refine the current way to measure L2 <-> L3 data traffic. We identify two events that count the dropped cache lines and the cache lines moved from the L2 to the L3 cache. For LIKWID 5.0.0 the performance groups (eventset + metrics + description) are extended to measure the found events, too, and therefore provide deeper knowledge in the cache behavior.
What is a victim cache
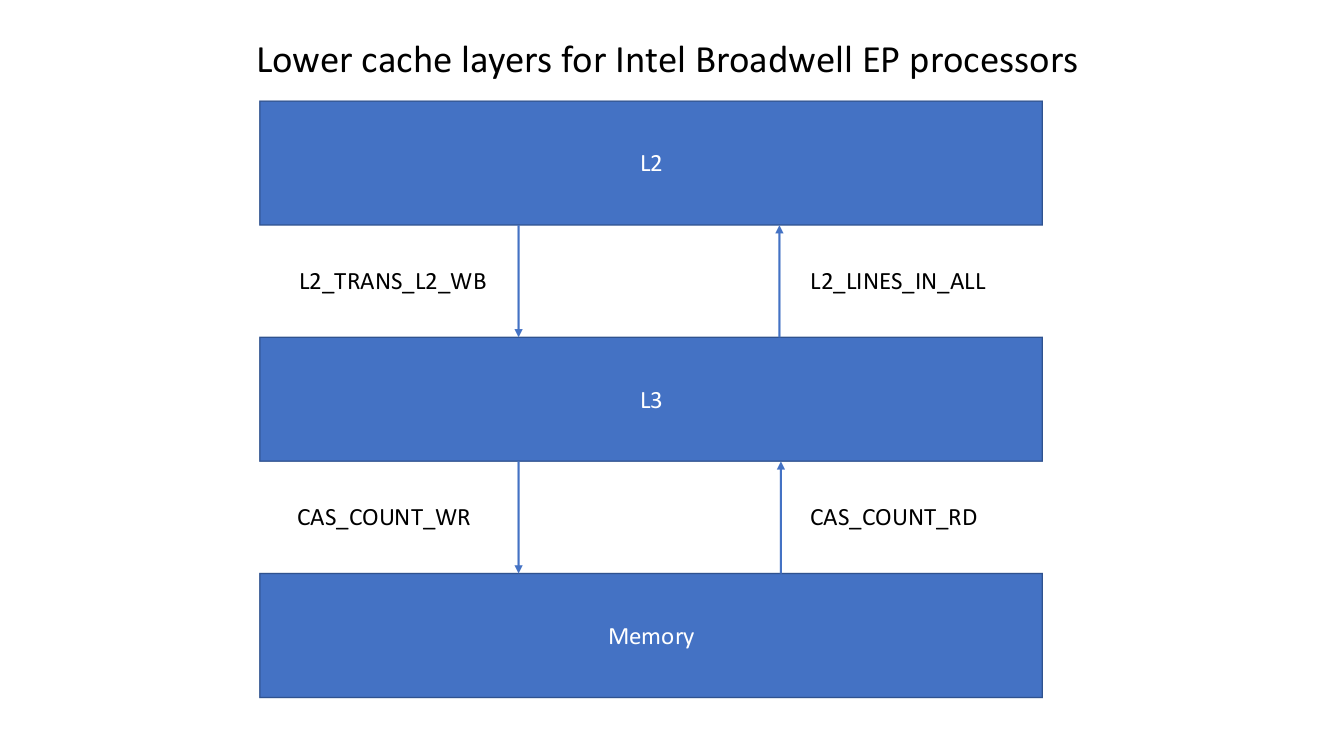
On all architectures before Intel Skylake SP (SKX), like Intel Broadwell EP (BDX), the caches are (mostly?) inclusive. This means that all cache lines that are currently in L1 are contained in L2 and L3 cache as well (same for all lines in L2 that are also present in L3). With Intel Skylake SP, the L3 cache became a victim cache (non-inclusive) while L1 and L2 continue being inclusive.
If a core requests data from memory, it is directly loaded into L2 (and then in L1) bypassing the L3 cache (**). If a cache lines need to be evicted from L2, the current line state is checked and, based on some heuristics which includes probability of reuse and sharing between cores and chips:
- cache line is dropped
- cache line is evicted to L3
- cache line is evicted directly to memory
The exact heuristics are not published by Intel.
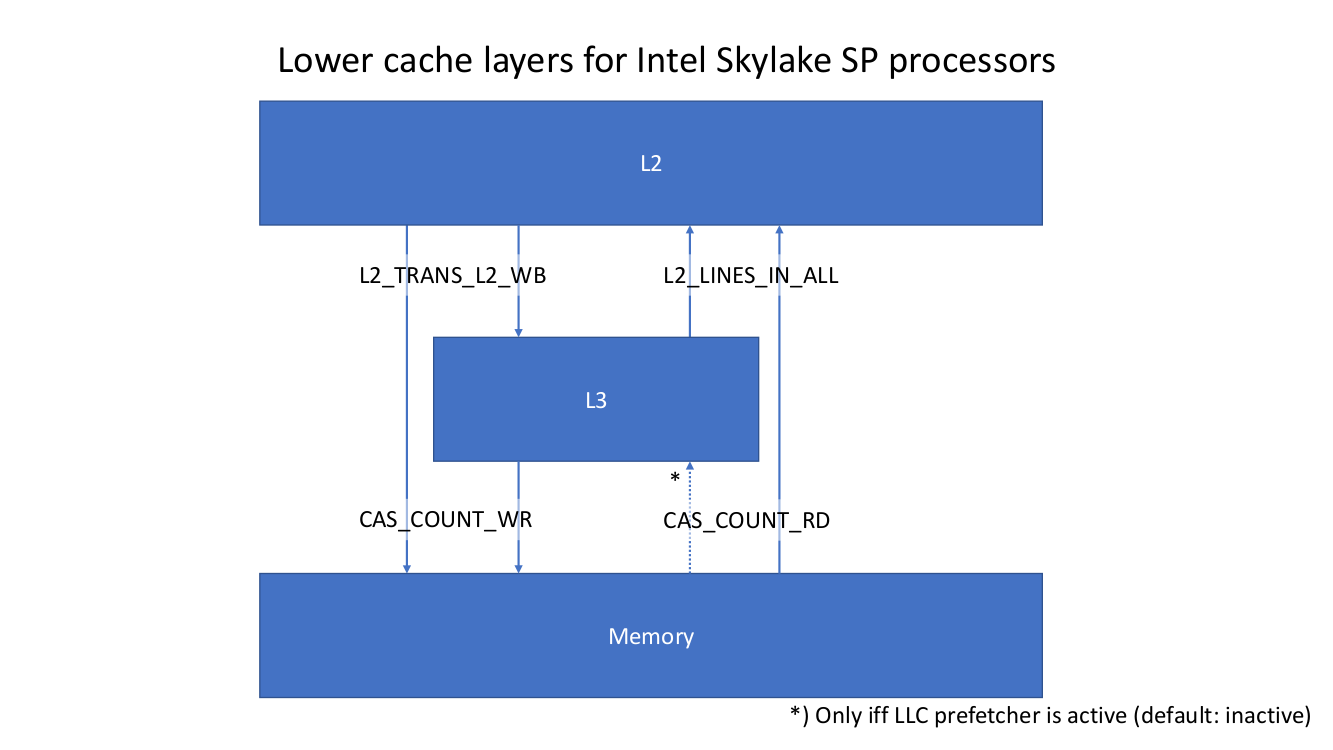
(**) Except the LLC prefetcher is active and pulls some cache lines from memory. Which it is on the Intel Skylake SP test system. But as we see later, the currently known events are not able to differentiate the L2 load traffic between L2 and either L3 or memory. The prefetcher accelerates the loading of data for streaming access, so we probably measure a higher load bandwidth due to the prefetcher but the analysis is based on data volume per iteration leaving out the factor time.
For the CPU architectures before Intel Skylake SP, LIKWID uses two events for loaded (L2_LINES_IN_ALL, rf107, (--)) and evicted (L2_TRANS_L2_WB, r40f0, (++)) cache lines. This was enough to achieve a high accuracy because all data coming from memory and going to memory has to flow through L2 and L3. With Intel Skylake SP the situation changed and the event L2_LINES_IN_ALL is the sum of loads from L3 and memory (simply all cache lines coming into L2 independent of the source). The same behavior is true for the L2_TRANS_L2_WB event. There is no differentiation between evicts to L3 and evicts to memory. The event simply counts all cache lines leaving the L2 cache. Instead of the L2_TRANS_L2_WB event, the Intel Skylake/Cascadelake SP architecuture provides two other usable events: L2_LINES_OUT_SILENT (r01F2) and L2_LINES_OUT_NON_SILENT (r02F2)
(--, ++) For the both architectures: Intel Broadwell EP and Intel Skylake SP.
| Event | BDX | SKX |
|---|---|---|
| L2_LINES_IN_ALL | This event counts the number of L2 cache lines filling the L2. Counting does not cover rejects. | Counts the number of L2 cache lines filling the L2. Counting does not cover rejects. |
| L2_TRANS_L2_WB | This event counts L2 writebacks that access L2 cache. | Counts L2 writebacks that access L2 cache. |
| L2_LINES_OUT_SILENT | - | Counts the number of lines that are silently dropped by L2 cache when triggered by an L2 cache fill. These lines are typically in Shared or Exclusive state. A non-threaded event. |
| L2_LINES_OUT_NON_SILENT | - | Counts the number of lines that are evicted by L2 cache when triggered by an L2 cache fill. Those lines can be either in modified state or clean state. Modified lines may either be written back to L3 or directly written to memory and not allocated in L3. Clean lines may either be allocated in L3 or dropped |
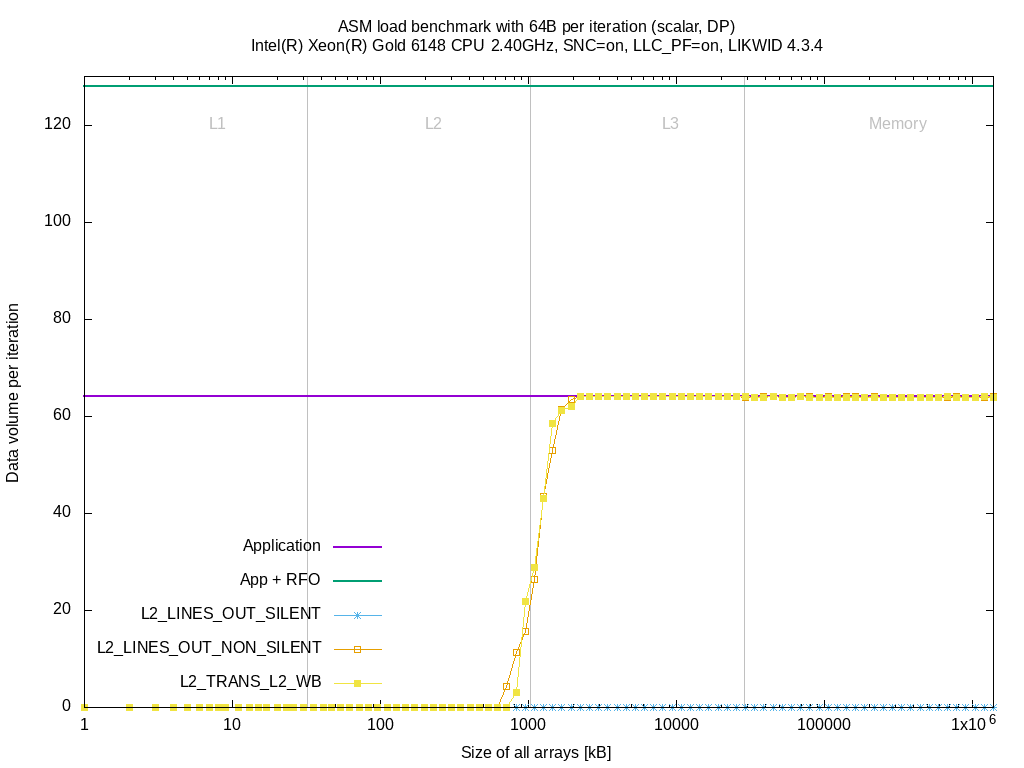
In order to show the difference at hardware level, I took some measurements (LIKWID version 4.3.4) with the current L3 group (BDX, SKX) using a single core on an Intel Broadwell EP (Intel(R) Xeon(R) CPU E5-2697 v4 @ 2.30GHz, CPU clock fixed to 2.30 GHz) and an Intel Skylake SP (Intel(R) Xeon(R) Gold 6148 CPU @ 2.40GHz, CPU clock fixed to 2.40 GHz). As benchmark application I used likwid-bench with the benchmarks:
-
load: register = A[i] -
store: A[i] = constant -
copy: A[i] = B[i] -
stream: A[i] = B[i] * c + C[i] -
triad: A[i] = B[i] * C[i] + D[i]
All benchmarks work on double precision floating-point arrays using scalar operations.
I mentioned that there are different events to measure the evict/writeback traffic from L2, so we test first whether our selection, the L2_TRANS_L2_WB event, provides better/worse results compared to the L2_LINES_OUT_* events.
In order to improve visibility, the remaining benchmarks are not directly shown but here are the links:
These plots clearly show no real difference in the measurements of L2_LINES_OUT_NON_SILENT and L2_TRANS_L2_WB under these workloads. The L2_LINES_OUT_SILENT event stays at zero for all kernels. There might be workloads that produce different pictures. The measurements are performed in two application runs, first the L2_TRANS_L2_WB and second all L2_LINES_OUT_* events.
So let's check full measurements to show the difference between BDX and SKX.
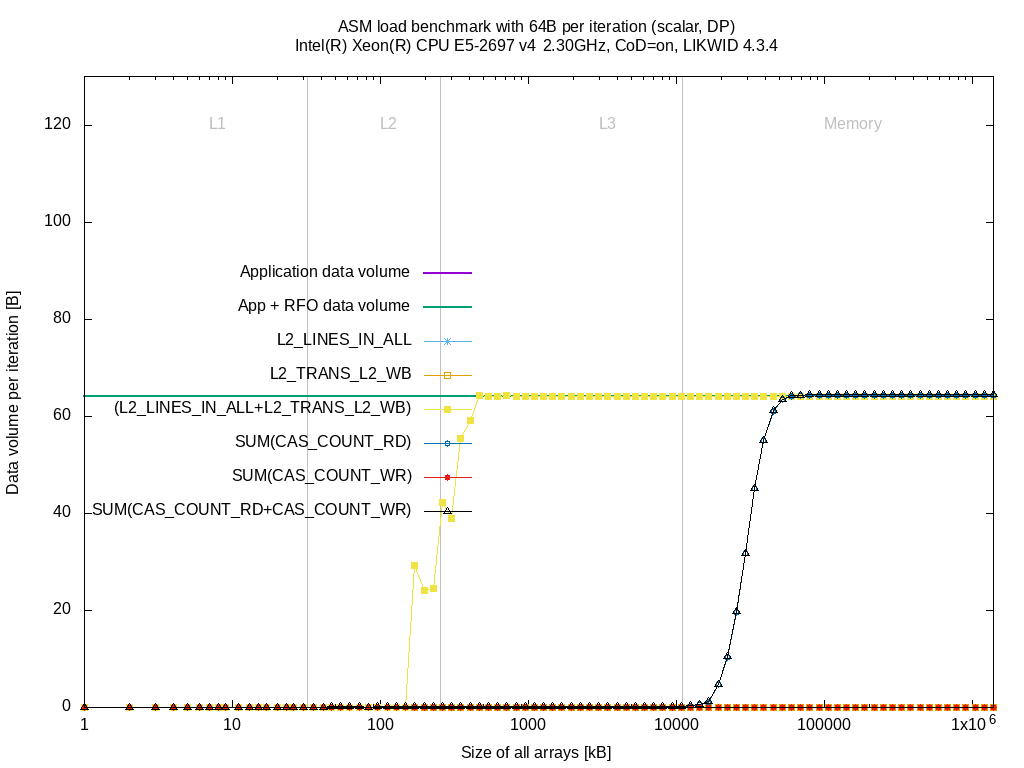
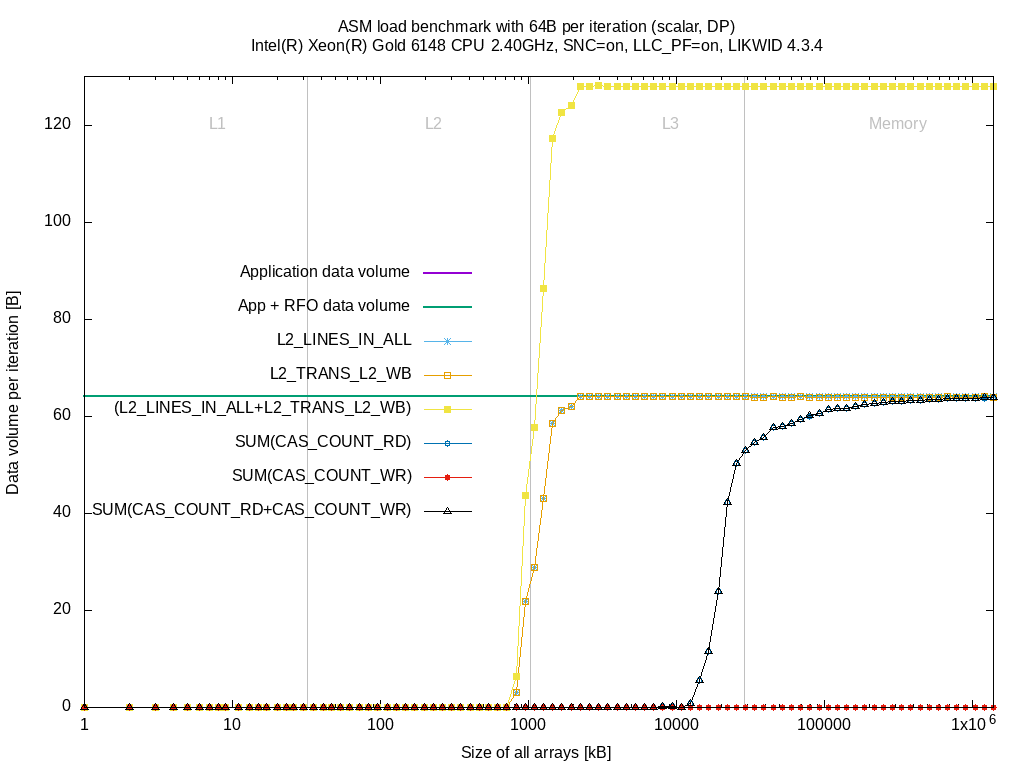
| BDX | SKX |
|---|---|
As soon as the data sizes fill the L2 cache almost completely, the bytes loaded from L3 (L2_LINES_IN_ALL) raises until it reaches the 64 Byte per iteration. |
When the L2 cache is almost full, the data is loaded from L3 (L2_LINES_IN_ALL) until we read 64 Byte per iteration. Same as for BDX. |
The benchmark does not evict any data, hence the L2_TRANS_L2_WB event stays zero |
L2_TRANS_L2_WB raises similar to (L2_LINES_IN_ALL). This is because the cache lines are evicted from L2 but they can be either evicted to L3, evicted to memory or being dropped. |
When the data sizes come closer to the L3 size (11 MByte as Cluster-on-Die is enabled), the data fetched from memory SUM(CAS_COUNT_RD) increases until 64 Byte |
When the data sizes come closer to the L3 size (full 28 MByte usable although SNC is enabled), the data fetched from memory SUM(CAS_COUNT_RD) increases until 64 Byte. |
SUM(CAS_COUNT_WR) stays zero |
SUM(CAS_COUNT_WR) stays zero |
The problem gets visible here already. Since the L2 cache lines are not commonly contained in the L3, the cache lines need to be moved from L2 to L3 which increase the measured writeback data volume although no data is written by the benchmark. Moreover, due to the behavior of the event L2_TRANS_L2_WB counting anything that is being written back passing L2, it is unclear what happens with the cache lines: evict to L3, evict to memory or dropping.
For completeness, here are the plots for the other benchmarks:
| Benchmark | BDX | SKX |
|---|---|---|
| store | link | link |
| copy | link | link |
| stream | link | link |
| triad | link | link |
The L3 performance group for Intel Skylake (version 4.3.4) uses the two events mentioned above. So, keep in mind that L2_LINES_IN_ALL contains loads from L3 and memory and L2_TRANS_L2_WB contains writebacks to L3 (and memory) as well as dropped cache lines. There are quite a few uncertainties here:
- Where is the data loaded from?
- Where is it evicted to?
- Have any cache lines been dropped?
I posted the question in the Intel developer forums and it's not only me/LIKWID having that problem. Others have also tried different events (also in the LLC units, LIKWID calls them CBOXes). At the current state, the events for traffic in and out of L2 do not allow a differentiation of the source or destination.
The memory traffic can be measured properly and with high accuracy assuming 64B for each read and write operation to memory. But the memory controllers are located in the Uncore part of the CPU and thus the counts reflect the traffic to/from all cores of a socket (+ intersocket traffic)
It is probably possible to use L3 events (part of the Uncore) to retrieve the counts for data flowing into L3, data being loaded by the L2 and the evictions to memory. But the Uncore is socket-specific and consequently does not allow the attribution of a single cores' data consumption. Furthermore, there are quite a few LLC units (BDX has 24 and SKX has 28) and each unit - with probably multiple counters per unit - have to be programmed and read.
After a meeting with Intel, we got a list of events:
- MEM_INST_RETIRED.ALL_LOADS (r81d0)
- MEM_INST_RETIRED.ALL_STORES (r82d0)
- MEM_LOAD_L3_HIT_RETIRED.XSNP_HIT (r02d2)
- MEM_LOAD_L3_HIT_RETIRED.XSNP_HITM (r04d2)
- MEM_LOAD_L3_HIT_RETIRED.XSNP_MISS (r01d2)
- MEM_LOAD_L3_HIT_RETIRED.XSNP_NONE (r08d2)
- MEM_LOAD_L3_MISS_RETIRED.LOCAL_DRAM (r01d3)
- MEM_LOAD_L3_MISS_RETIRED.REMOTE_DRAM (r02d3)
- MEM_LOAD_L3_MISS_RETIRED.REMOTE_L4 (**)
- MEM_LOAD_MISC_RETIRED.NON_DRAM (**)
- MEM_LOAD_MISC_RETIRED.UC (r04d4)
- MEM_LOAD_MISC_RETIRED.UNKNOWN_SOURCE (**)
All events marked with (**) are not published and consequently not usable by LIKWID and other tools. We tried the other events but for some it was clear that it wouldn't work. E.g. the MEM_INST_RETIRED.ALL_* events count the number of loads resp. stores that are issued, executed and retired (completed) by the core, hence some units away from L2, L3 and memory. Moreover, there are cases where an instruction triggers data movement in the background (e.g. read-for-ownership for stores where the destination cache line is not present in the L1 cache) which are not covered by these two events.
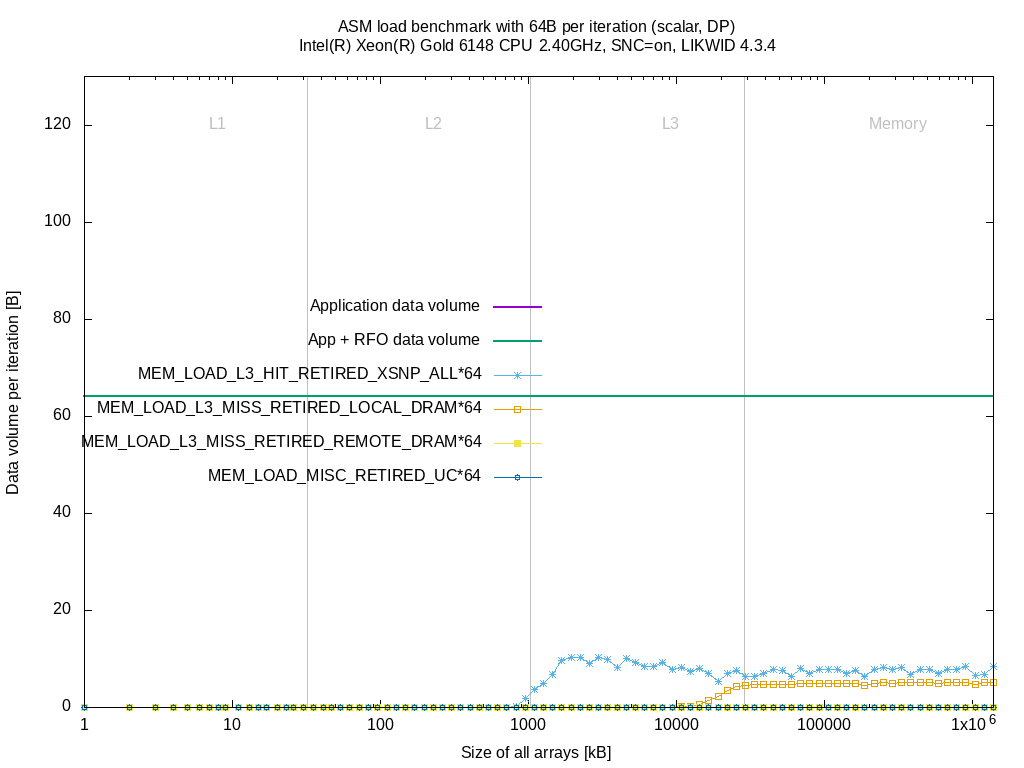
I did the same measurements as above on the Skylake SP system. I left out the MEM_INST_RETIRED.ALL_* events and combined all MEM_LOAD_L3_HIT_RETIRED.XSNP_* to a single event MEM_LOAD_L3_HIT_RETIRED.XSNP_ALL.
These events don't provide any further insight. The counts raise for some benchmarks when sizes fit in L3 or memory but it's hard to find a relation between these events and the application model (data volume per iteration).
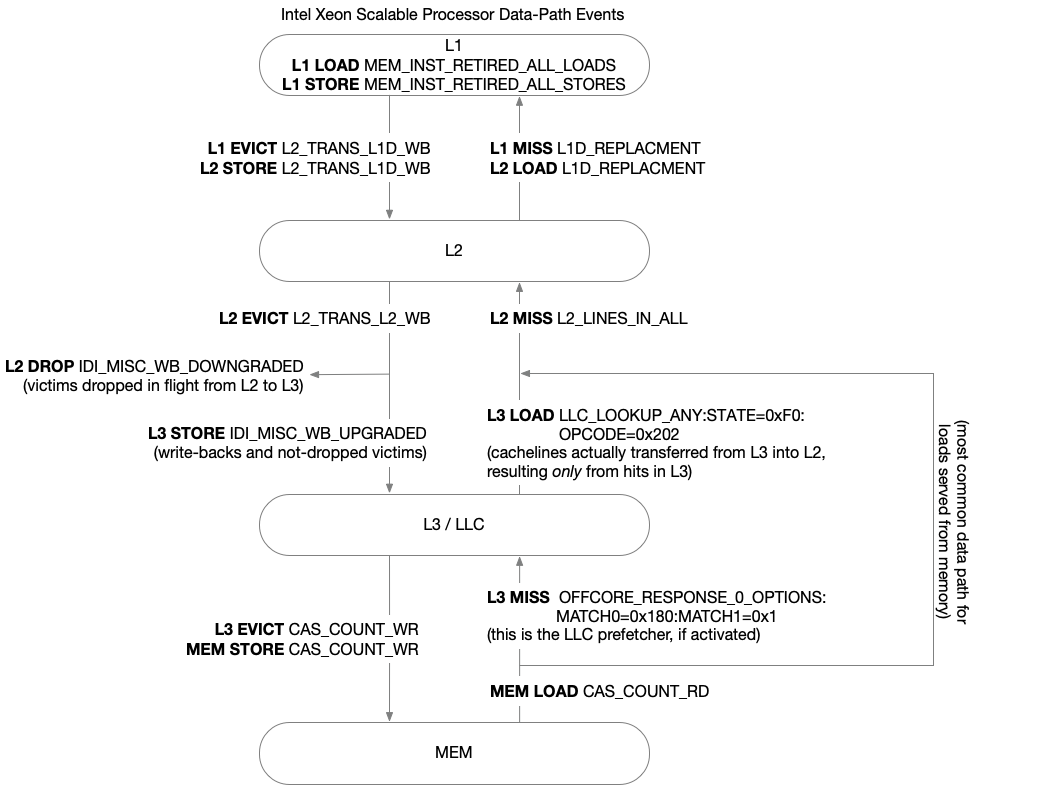
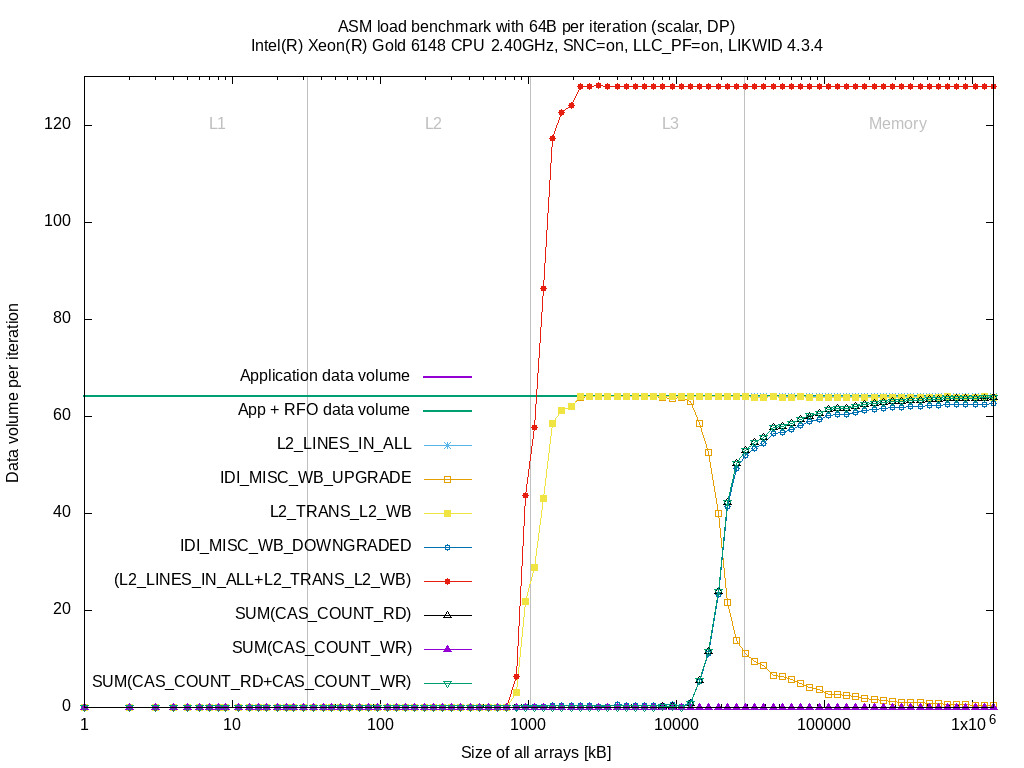
When releasing the Intel Cascadelake SP/AP chips, Intel published two new events IDI_MISC.WB_UPGRADE (Description: Counts number of cache lines that are allocated and written back to L3 with the intention that they are more likely to be reused shortly) and IDI_MISC.WB_DOWNGRADE (Description: Counts number of cache lines that are dropped and not written back to L3 as they are deemed to be less likely to be reused shortly). Whole list of Cascadelake SP/AP events here. One of the problems is, that these events are already mentioned in the errata section of the specification update document for Intel Cascadelake SP/AP:
CLX3. IDI_MISC Performance Monitoring Events May be Inaccurate
Problem: The IDI_MISC.WB_UPGRADE and IDI_MISC.WB_DOWNGRADE performance monitoring events (Event FEH; UMask 02H and 04H) counts cache lines evicted from the L2 cache. Due to this erratum, the per logical processor count may be incorrect when both logical processors on the same physical core are active. The aggregate count of both logical processors is not affected by this erratum.
Implication: IDI_MISC performance monitoring events may be inaccurate.
Workaround: None identified.
Status:No fix.
In fact, Intel published these events for Intel Skylake SP already a long time ago but I havn't seen them in the wild. They are not listed in the Intel forum post and other hardware performance monitoring software is also not using it. I ran some benchmarks using a single core to get accurate results. Same configuration as in the above comparison between Intel Broadwell EP and Intel Skylake SP.
The event IDI_MISC_WB_UPGRADE raises similar to the L2_TRANS_L2_WB event when sizes reach full L2 size. At about 75% of the L3 size, the evictions with reuse hint to L3 (IDI_MISC_WB_UPGRADE) decrease and cache lines drops raise (IDI_MISC_WB_DOWNGRADE). Similar to the drops, the reads from memory increase as, after dropping, the L2 has to re-read the cache lines from memory.
So for accurate measurements of the writeback path, you need to measure IDI_MISC_WB_UPGRADE and IDI_MISC_WB_DOWNGRADE besides L2_TRANS_L2_WB.
The results show:
- The events work for Intel Skylake SP although released only for Intel Cascadelake SP
- The L2 writeback path can be characterized. No information about L3 writebacks.
- No information about the load path (##)
So, for better results from the L3 performance group, we should include both IDI_MISC_WB* events. In this counter we could measure the L3 hits to characterize the load path. Unfortunately, the MEM_LOAD_L3_* are likely to be listed in the specification updates. This is not the case for Intel Skylake SP but for Intel Skylake Desktop (SKL128) and many previous CPU generations (BDX, HSX, SNB-EP).
(##) Commonly, all data should be loaded from memory directly to L2 except the LLC prefetcher is active (like in this case). One might assume that all cache lines evicted to L3 for re-use are also loaded again from L3 but that would mean that the heuristics are always the optimal decision.
For the version 5.0.0, the L3 group for Intel Skylake SP and Intel Cascadelake SP was updated to include the IDI_MISC_WB_*`. Starting with this version, you get more information and derived metrics from the L3 performance group:
L3 evict bandwidth [MBytes/s] = 1.0E-06*IDI_MISC_WB_UPGRADE*64.0/time
L3 evict data volume [GBytes] = 1.0E-09*L2_TRANS_L2_WB*64.0
L3 evict data volume [GBytes] = 1.0E-09*IDI_MISC_WB_UPGRADE*64.0
Dropped CLs bandwidth [MBytes/s] = 1.0E-9*IDI_MISC_WB_DOWNGRADE*64.0/time
Dropped CLs data volume [GBytes] = 1.0E-9*IDI_MISC_WB_DOWNGRADE*64.0
L3|MEM evict bandwidth [MBytes/s] = 1.0E-06*L2_TRANS_L2_WB*64.0/time
L3|MEM evict data volume [GBytes] = 1.0E-09*L2_TRANS_L2_WB*64.0
L3 load bandwidth|L3 load data volume and the total L3 bandwidth|L3 data volume is untouched. We still have the problem that the source of loads (either memory or L3) cannot be determined.