AccuracyWestmere
CPU name: Intel(R) Xeon(R) CPU X5650 @ 2.67GHz
CPU stepping: 2
Sockets: 2
Cores per socket: 6
Threads per core: 2
Total number of processing units: 24
Not all performance groups can be tested for accuracy. We don't have a test application for each performance group. Here only the groups are listed that can be verified. Each group is followed by the low-level benchmarks that are performed for comparison.
| Group | Tests |
|---|---|
| CLOCK | load, daxpy, stream, ddot, triad, copy, store |
| MEM | load, copy, stream, ddot, triad, daxpy, store |
| FLOPS_SP | triad_sp_sse, sum_sp_sse, sum_sp, daxpy_sp, triad_sp, ddot_sp_sse, stream_sp_sse, ddot_sp, stream_sp, daxpy_sp_sse |
| L2 | load, copy, stream, ddot, triad, daxpy, store |
| L3 | load, copy, stream, ddot, triad, daxpy, store |
| BRANCH | load, triad, copy, store, stream |
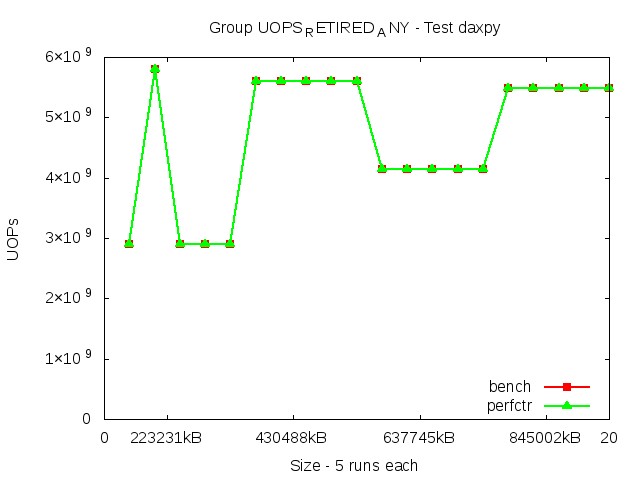
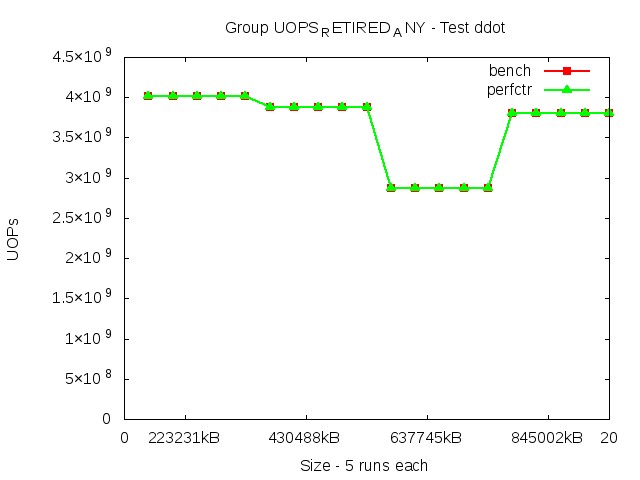
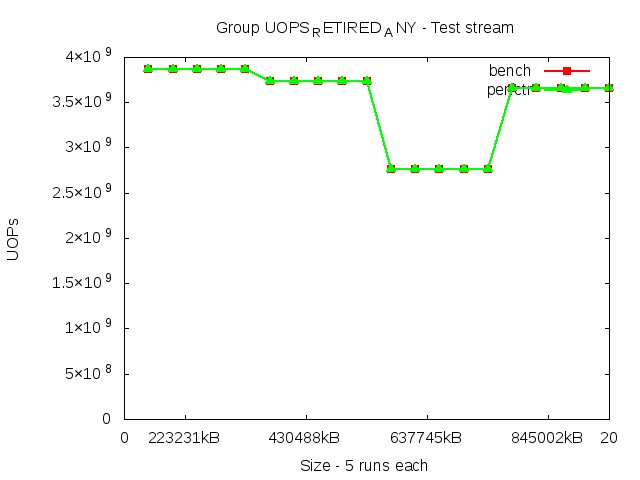
| UOPS | triad, daxpy, ddot, stream |
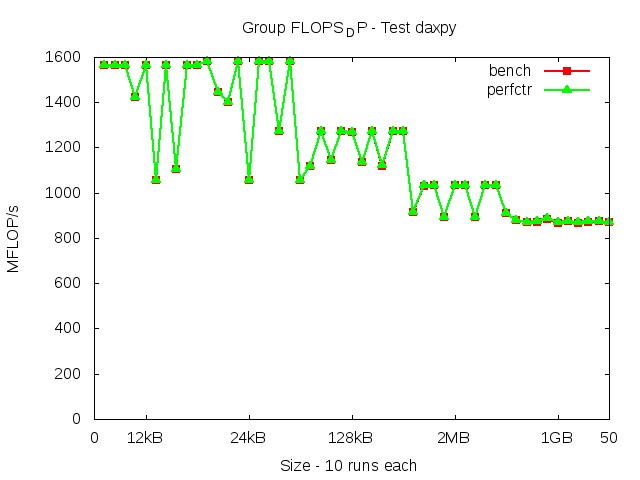
| FLOPS_DP | triad_sse, stream_sse, stream, sum_sse, sum, ddot_sse, ddot, daxpy_sse, triad, daxpy |
| DATA | triad, copy, stream, store |
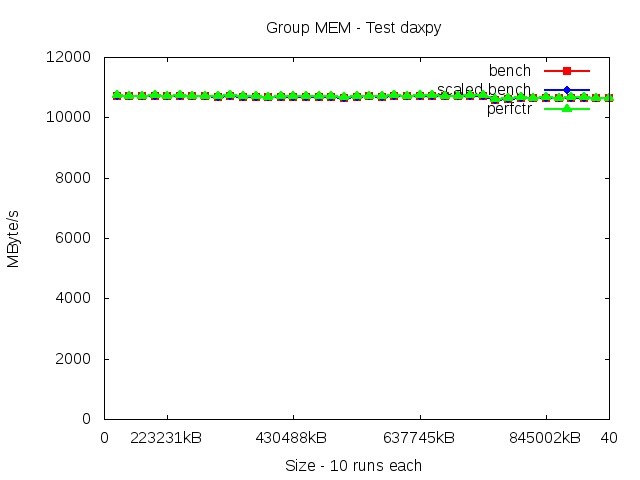
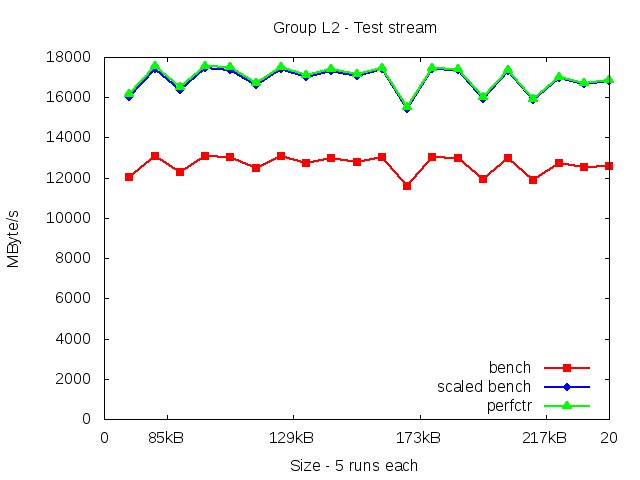
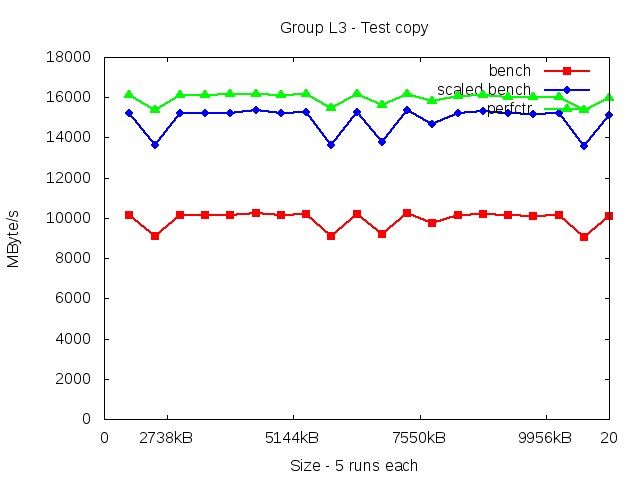
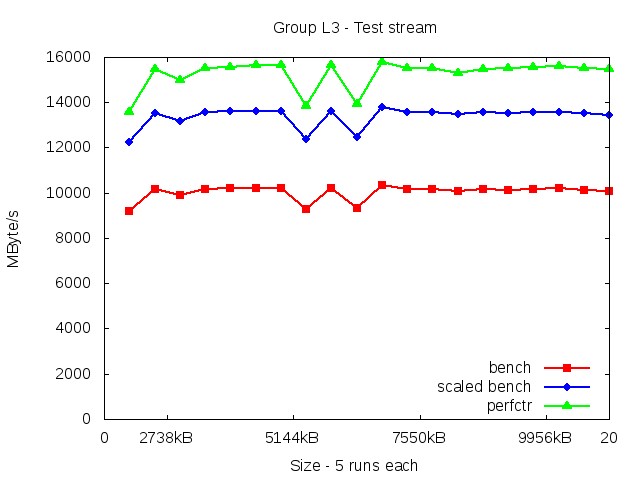
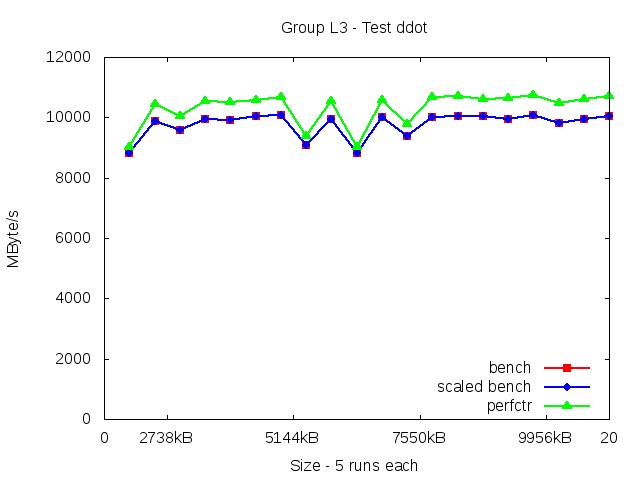
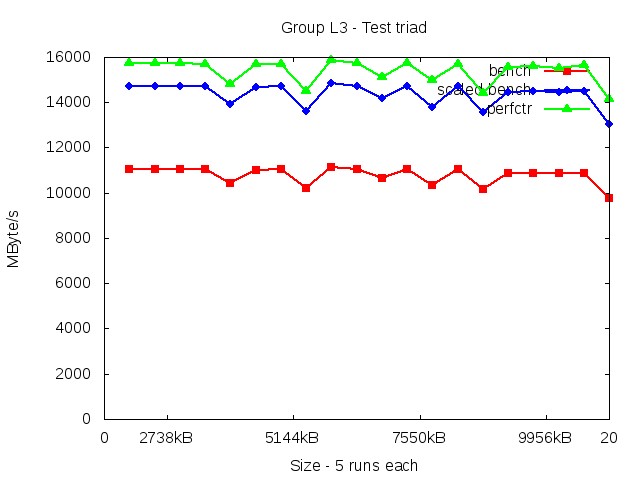
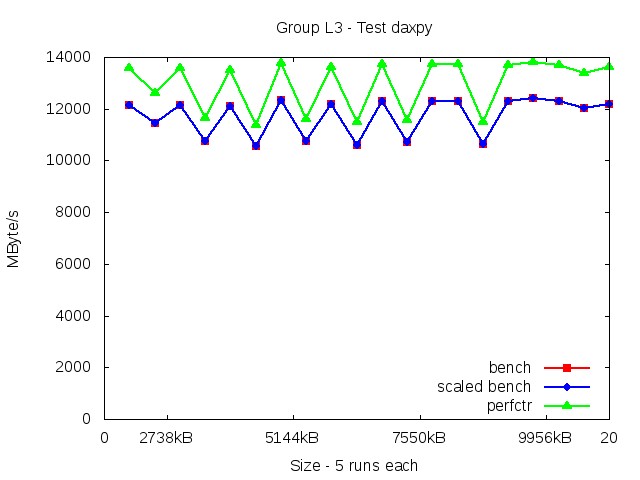
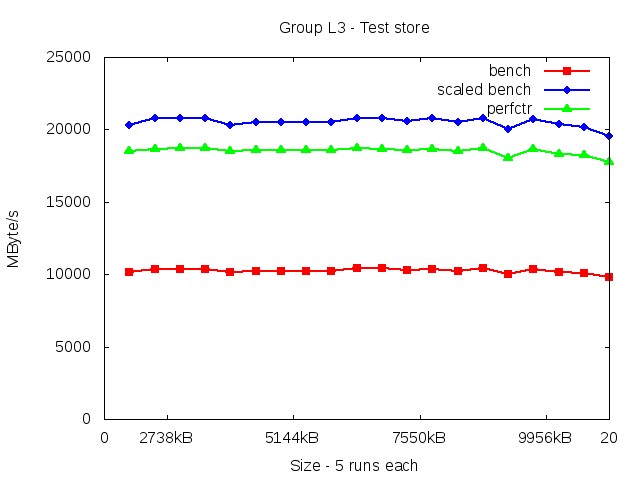
For memory bandwidth accuracy tests, the result of likwid-bench needs to be scaled to represent the real values. The reason is traffic caused by write-allocates (the store operation on a cache line that is not present at the L1 cache must be loaded first before the store operation can complete). In these cases, the figures contain three curves, the original output of likwid-bench, the scaled version and the derived metrics of likwid-perfctr measurements.
Benchmark performed with data sizes: 223231kB, 430488kB, 637745kB, 845002kB.
Each data size is tested 5 times, hence the first 5 entries on the x-axis correspond to the 5 runs for the first data size of 223231kB and so on.
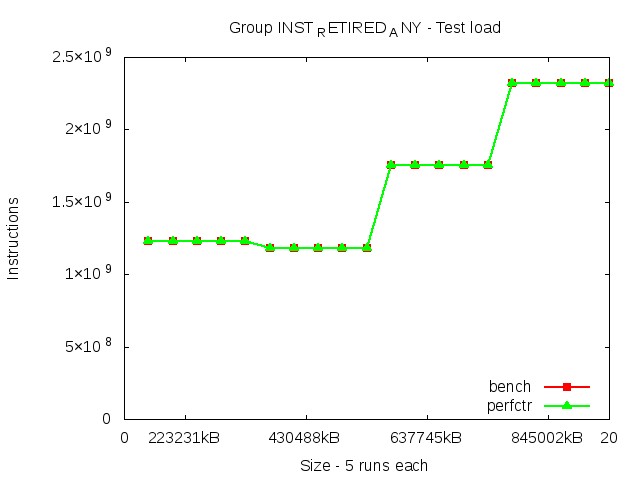
The table contains the values after scaling the original values up using the scaling factor 1.00. The table entries for BENCH and LIKWID have the unit 'Instructions'
| Variant | BENCH (Min) | LIKWID (Min) | Error (Min) | BENCH (Max) | LIKWID (Max) | Error (Max) | BENCH (Avg) | LIKWID (Avg) | Error (Avg) |
|---|---|---|---|---|---|---|---|---|---|
| 223231kB | 1227770384.00 | 1227777000.00 | 0.00% | 1227770384.00 | 1227777000.00 | 0.00% | 1227770384.00 | 1227777000.00 | 0.00% |
| 430488kB | 1183842016.00 | 1183848000.00 | 0.00% | 1183842016.00 | 1183848000.00 | 0.00% | 1183842016.00 | 1183848000.00 | 0.00% |
| 637745kB | 1753798656.00 | 1753805000.00 | 0.00% | 1753798656.00 | 1753805000.00 | 0.00% | 1753798656.00 | 1753805000.00 | 0.00% |
| 845002kB | 2323755472.00 | 2323762000.00 | 0.00% | 2323755472.00 | 2323762000.00 | 0.00% | 2323755472.00 | 2323762000.00 | 0.00% |
Benchmark performed with data sizes: 223231kB, 430488kB, 637745kB, 845002kB.
Each data size is tested 5 times, hence the first 5 entries on the x-axis correspond to the 5 runs for the first data size of 223231kB and so on.
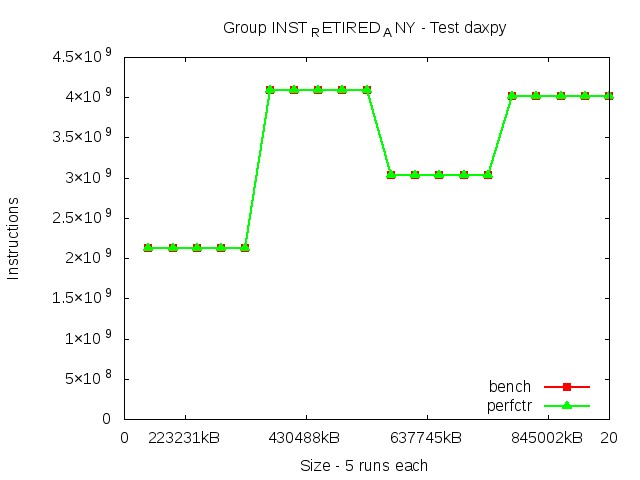
The table contains the values after scaling the original values up using the scaling factor 1.00. The table entries for BENCH and LIKWID have the unit 'Instructions'
| Variant | BENCH (Min) | LIKWID (Min) | Error (Min) | BENCH (Max) | LIKWID (Max) | Error (Max) | BENCH (Avg) | LIKWID (Avg) | Error (Avg) |
|---|---|---|---|---|---|---|---|---|---|
| 223231kB | 2120694289.00 | 2120701000.00 | 0.00% | 2120694289.00 | 2120701000.00 | 0.00% | 2120694289.00 | 2120701000.00 | 0.00% |
| 430488kB | 4089636017.00 | 4089643000.00 | 0.00% | 4089636017.00 | 4089643000.00 | 0.00% | 4089636017.00 | 4089643000.00 | 0.00% |
| 637745kB | 3029288577.00 | 3029295000.00 | 0.00% | 3029288577.00 | 3029295000.00 | 0.00% | 3029288577.00 | 3029295000.00 | 0.00% |
| 845002kB | 4013759441.00 | 4013766000.00 | 0.00% | 4013759441.00 | 4013766000.00 | 0.00% | 4013759441.00 | 4013766000.00 | 0.00% |
Benchmark performed with data sizes: 223231kB, 430488kB, 637745kB, 845002kB.
Each data size is tested 5 times, hence the first 5 entries on the x-axis correspond to the 5 runs for the first data size of 223231kB and so on.
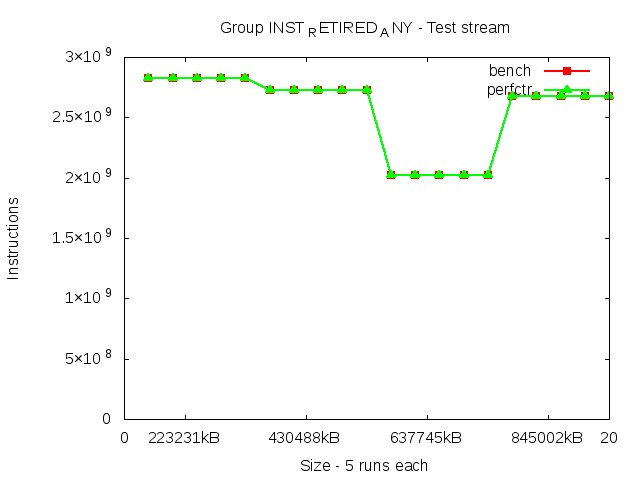
The table contains the values after scaling the original values up using the scaling factor 1.00. The table entries for BENCH and LIKWID have the unit 'Instructions'
| Variant | BENCH (Min) | LIKWID (Min) | Error (Min) | BENCH (Max) | LIKWID (Max) | Error (Max) | BENCH (Avg) | LIKWID (Avg) | Error (Avg) |
|---|---|---|---|---|---|---|---|---|---|
| 223231kB | 2827591569.00 | 2827600000.00 | 0.00% | 2827591569.00 | 2827600000.00 | 0.00% | 2827591569.00 | 2827600000.00 | 0.00% |
| 430488kB | 2726424017.00 | 2726431000.00 | 0.00% | 2726424017.00 | 2726431000.00 | 0.00% | 2726424017.00 | 2726431000.00 | 0.00% |
| 637745kB | 2019525825.00 | 2019532000.00 | 0.00% | 2019525825.00 | 2019532000.00 | 0.00% | 2019525825.00 | 2019532000.00 | 0.00% |
| 845002kB | 2675839633.00 | 2675846000.00 | 0.00% | 2675839633.00 | 2675846000.00 | 0.00% | 2675839633.00 | 2675846000.00 | 0.00% |
Benchmark performed with data sizes: 223231kB, 430488kB, 637745kB, 845002kB.
Each data size is tested 5 times, hence the first 5 entries on the x-axis correspond to the 5 runs for the first data size of 223231kB and so on.
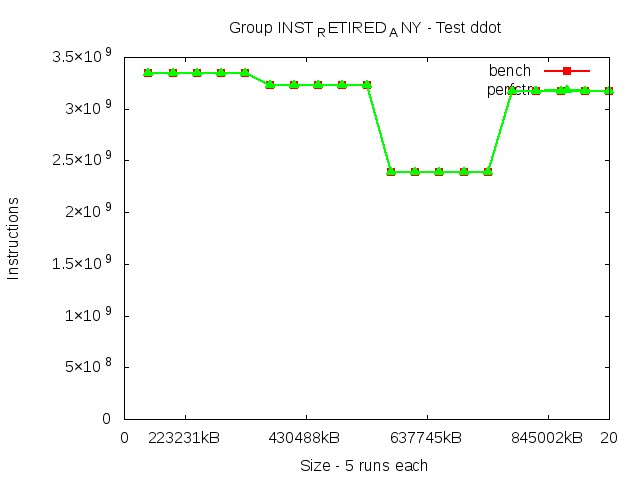
The table contains the values after scaling the original values up using the scaling factor 1.00. The table entries for BENCH and LIKWID have the unit 'Instructions'
| Variant | BENCH (Min) | LIKWID (Min) | Error (Min) | BENCH (Max) | LIKWID (Max) | Error (Max) | BENCH (Avg) | LIKWID (Avg) | Error (Avg) |
|---|---|---|---|---|---|---|---|---|---|
| 223231kB | 3348464660.00 | 3348473000.00 | 0.00% | 3348464660.00 | 3348473000.00 | 0.00% | 3348464660.00 | 3348473000.00 | 0.00% |
| 430488kB | 3228660020.00 | 3228667000.00 | 0.00% | 3228660020.00 | 3228667000.00 | 0.00% | 3228660020.00 | 3228667000.00 | 0.00% |
| 637745kB | 2391543620.00 | 2391550000.00 | 0.00% | 2391543620.00 | 2391550000.00 | 0.00% | 2391543620.00 | 2391550000.00 | 0.00% |
| 845002kB | 3168757460.00 | 3168764000.00 | 0.00% | 3168757460.00 | 3168764000.00 | 0.00% | 3168757460.00 | 3168764000.00 | 0.00% |
Benchmark performed with data sizes: 223231kB, 430488kB, 637745kB, 845002kB.
Each data size is tested 5 times, hence the first 5 entries on the x-axis correspond to the 5 runs for the first data size of 223231kB and so on.
The table contains the values after scaling the original values up using the scaling factor 1.00. The table entries for BENCH and LIKWID have the unit 'Instructions'
| Variant | BENCH (Min) | LIKWID (Min) | Error (Min) | BENCH (Max) | LIKWID (Max) | Error (Max) | BENCH (Avg) | LIKWID (Avg) | Error (Avg) |
|---|---|---|---|---|---|---|---|---|---|
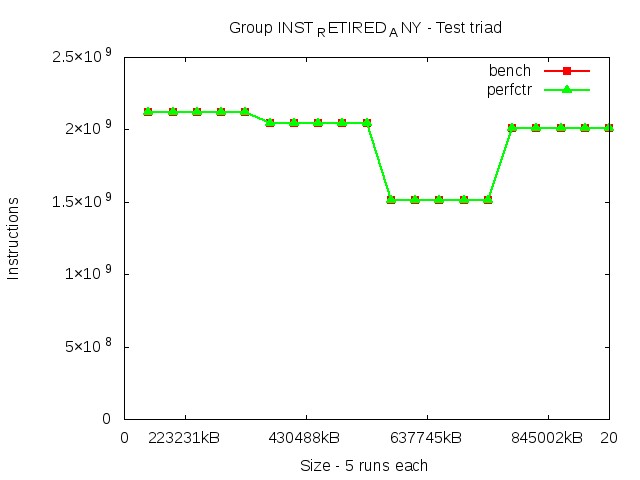
| 223231kB | 2120694288.00 | 2120702000.00 | 0.00% | 2120694288.00 | 2120702000.00 | 0.00% | 2120694288.00 | 2120702000.00 | 0.00% |
| 430488kB | 2044817712.00 | 2044825000.00 | 0.00% | 2044817712.00 | 2044825000.00 | 0.00% | 2044817712.00 | 2044825000.00 | 0.00% |
| 637745kB | 1514644144.00 | 1514651000.00 | 0.00% | 1514644144.00 | 1514651000.00 | 0.00% | 1514644144.00 | 1514651000.00 | 0.00% |
| 845002kB | 2006879728.00 | 2006886000.00 | 0.00% | 2006879728.00 | 2006886000.00 | 0.00% | 2006879728.00 | 2006886000.00 | 0.00% |
Benchmark performed with data sizes: 223231kB, 430488kB, 637745kB, 845002kB.
Each data size is tested 5 times, hence the first 5 entries on the x-axis correspond to the 5 runs for the first data size of 223231kB and so on.
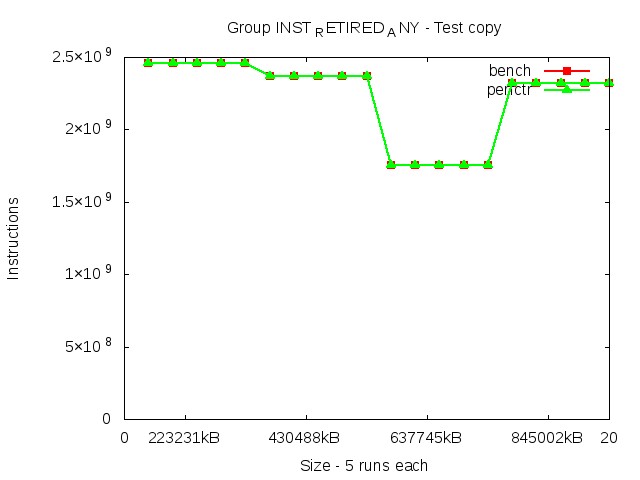
The table contains the values after scaling the original values up using the scaling factor 1.00. The table entries for BENCH and LIKWID have the unit 'Instructions'
| Variant | BENCH (Min) | LIKWID (Min) | Error (Min) | BENCH (Max) | LIKWID (Max) | Error (Max) | BENCH (Avg) | LIKWID (Avg) | Error (Avg) |
|---|---|---|---|---|---|---|---|---|---|
| 223231kB | 2455540752.00 | 2455549000.00 | 0.00% | 2455540752.00 | 2455549000.00 | 0.00% | 2455540752.00 | 2455549000.00 | 0.00% |
| 430488kB | 2367684016.00 | 2367691000.00 | 0.00% | 2367684016.00 | 2367691000.00 | 0.00% | 2367684016.00 | 2367691000.00 | 0.00% |
| 637745kB | 1753798656.00 | 1753805000.00 | 0.00% | 1753798656.00 | 1753805000.00 | 0.00% | 1753798656.00 | 1753805000.00 | 0.00% |
| 845002kB | 2323755472.00 | 2323762000.00 | 0.00% | 2323755472.00 | 2323762000.00 | 0.00% | 2323755472.00 | 2323762000.00 | 0.00% |
Benchmark performed with data sizes: 223231kB, 430488kB, 637745kB, 845002kB.
Each data size is tested 5 times, hence the first 5 entries on the x-axis correspond to the 5 runs for the first data size of 223231kB and so on.
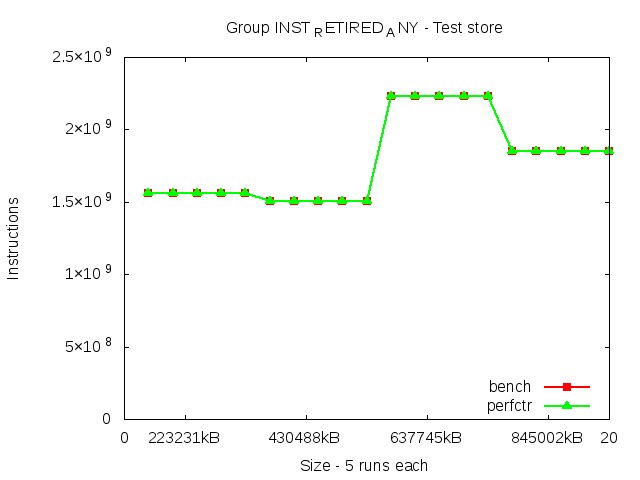
The table contains the values after scaling the original values up using the scaling factor 1.00. The table entries for BENCH and LIKWID have the unit 'Instructions'
| Variant | BENCH (Min) | LIKWID (Min) | Error (Min) | BENCH (Max) | LIKWID (Max) | Error (Max) | BENCH (Avg) | LIKWID (Avg) | Error (Avg) |
|---|---|---|---|---|---|---|---|---|---|
| 223231kB | 1562616852.00 | 1562624000.00 | 0.00% | 1562616852.00 | 1562624000.00 | 0.00% | 1562616852.00 | 1562624000.00 | 0.00% |
| 430488kB | 1506708020.00 | 1506714000.00 | 0.00% | 1506708020.00 | 1506714000.00 | 0.00% | 1506708020.00 | 1506714000.00 | 0.00% |
| 637745kB | 2232107492.00 | 2232114000.00 | 0.00% | 2232107492.00 | 2232114000.00 | 0.00% | 2232107492.00 | 2232114000.00 | 0.00% |
| 845002kB | 1848441860.00 | 1848448000.00 | 0.00% | 1848441860.00 | 1848448000.00 | 0.00% | 1848441860.00 | 1848448000.00 | 0.00% |
Benchmark performed with data sizes: 218725kB, 426801kB, 634877kB, 842953kB.
Each data size is tested 10 times, hence the first 10 entries on the x-axis correspond to the 10 runs for the first data size of 218725kB and so on.
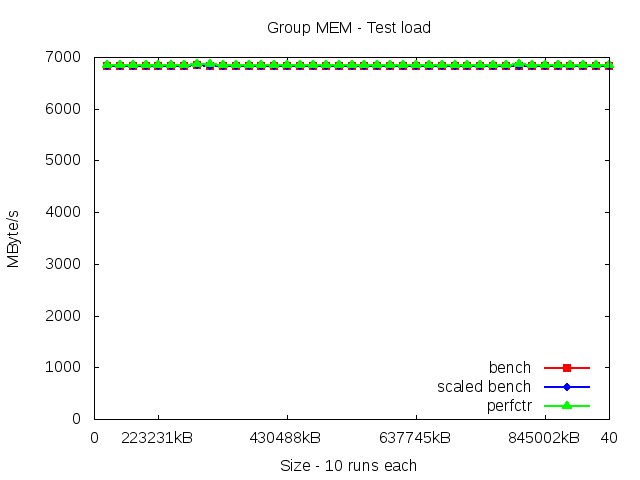
The table contains the values after scaling the original values up using the scaling factor 1.00. The table entries for BENCH and LIKWID have the unit 'MByte/s'
| Variant | BENCH (Min) | LIKWID (Min) | Error (Min) | BENCH (Max) | LIKWID (Max) | Error (Max) | BENCH (Avg) | LIKWID (Avg) | Error (Avg) |
|---|---|---|---|---|---|---|---|---|---|
| 218725kB | 6833.00 | 6849.80 | 0.25% | 6828.00 | 6858.16 | 0.44% | 6831.90 | 6850.73 | 0.28% |
| 426801kB | 6832.00 | 6848.23 | 0.24% | 6827.00 | 6851.59 | 0.36% | 6830.90 | 6849.43 | 0.27% |
| 634877kB | 6833.00 | 6848.65 | 0.23% | 6830.00 | 6850.01 | 0.29% | 6831.60 | 6849.91 | 0.27% |
| 842953kB | 6832.00 | 6847.96 | 0.23% | 6829.00 | 6862.24 | 0.49% | 6831.50 | 6851.11 | 0.29% |
Benchmark performed with data sizes: 218725kB, 426801kB, 634877kB, 842953kB.
Each data size is tested 10 times, hence the first 10 entries on the x-axis correspond to the 10 runs for the first data size of 218725kB and so on.
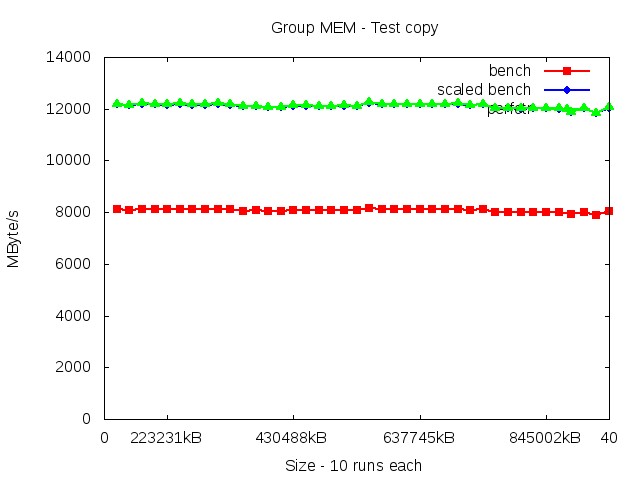
The table contains the values after scaling the original values up using the scaling factor 1.50. The table entries for BENCH and LIKWID have the unit 'MByte/s'
| Variant | BENCH (Min) | LIKWID (Min) | Error (Min) | BENCH (Max) | LIKWID (Max) | Error (Max) | BENCH (Avg) | LIKWID (Avg) | Error (Avg) |
|---|---|---|---|---|---|---|---|---|---|
| 218725kB | 12159.00 | 12171.30 | 0.10% | 12160.50 | 12177.62 | 0.14% | 12170.70 | 12185.76 | 0.12% |
| 426801kB | 12096.00 | 12106.97 | 0.09% | 12064.50 | 12082.83 | 0.15% | 12096.90 | 12109.74 | 0.11% |
| 634877kB | 12187.50 | 12199.49 | 0.10% | 12234.00 | 12248.17 | 0.12% | 12182.40 | 12195.46 | 0.11% |
| 842953kB | 11866.50 | 11877.54 | 0.09% | 12003.00 | 12017.94 | 0.12% | 11986.20 | 11998.99 | 0.11% |
Benchmark performed with data sizes: 218725kB, 426801kB, 634877kB, 842953kB.
Each data size is tested 10 times, hence the first 10 entries on the x-axis correspond to the 10 runs for the first data size of 218725kB and so on.
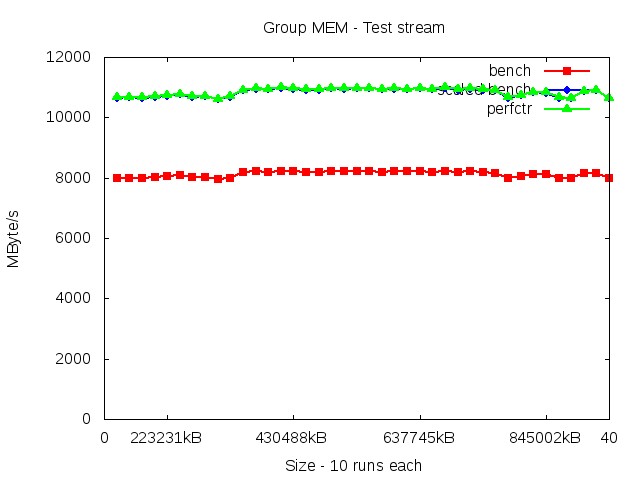
The table contains the values after scaling the original values up using the scaling factor 1.33. The table entries for BENCH and LIKWID have the unit 'MByte/s'
| Variant | BENCH (Min) | LIKWID (Min) | Error (Min) | BENCH (Max) | LIKWID (Max) | Error (Max) | BENCH (Avg) | LIKWID (Avg) | Error (Avg) |
|---|---|---|---|---|---|---|---|---|---|
| 218725kB | 10770.40 | 10784.88 | 0.13% | 10719.73 | 10738.02 | 0.17% | 10678.80 | 10695.65 | 0.16% |
| 426801kB | 10967.73 | 10982.14 | 0.13% | 10917.06 | 10934.67 | 0.16% | 10939.19 | 10955.06 | 0.15% |
| 634877kB | 10934.39 | 10949.28 | 0.14% | 10921.06 | 10938.61 | 0.16% | 10943.46 | 10959.65 | 0.15% |
| 842953kB | 10869.06 | 10882.89 | 0.13% | 10731.73 | 10749.16 | 0.16% | 10760.93 | 10776.30 | 0.14% |
Benchmark performed with data sizes: 218725kB, 426801kB, 634877kB, 842953kB.
Each data size is tested 10 times, hence the first 10 entries on the x-axis correspond to the 10 runs for the first data size of 218725kB and so on.
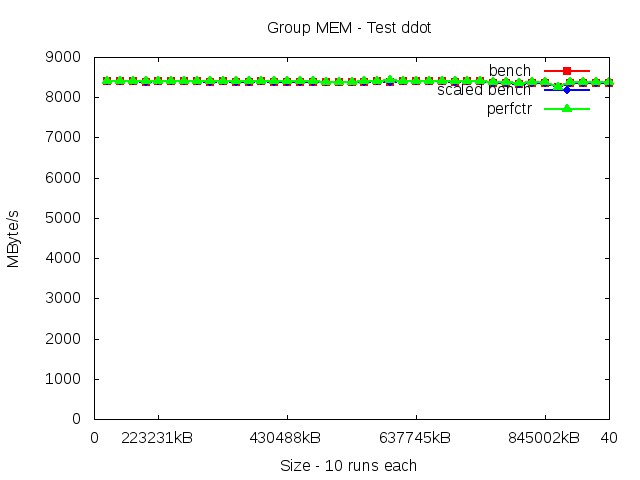
The table contains the values after scaling the original values up using the scaling factor 1.00. The table entries for BENCH and LIKWID have the unit 'MByte/s'
| Variant | BENCH (Min) | LIKWID (Min) | Error (Min) | BENCH (Max) | LIKWID (Max) | Error (Max) | BENCH (Avg) | LIKWID (Avg) | Error (Avg) |
|---|---|---|---|---|---|---|---|---|---|
| 218725kB | 8392.00 | 8408.14 | 0.19% | 8380.00 | 8414.06 | 0.41% | 8391.00 | 8410.23 | 0.23% |
| 426801kB | 8381.00 | 8397.42 | 0.20% | 8383.00 | 8400.69 | 0.21% | 8379.20 | 8396.26 | 0.20% |
| 634877kB | 8394.00 | 8410.26 | 0.19% | 8385.00 | 8421.99 | 0.44% | 8391.40 | 8411.63 | 0.24% |
| 842953kB | 8354.00 | 8369.82 | 0.19% | 8356.00 | 8375.62 | 0.23% | 8343.50 | 8361.36 | 0.21% |
Benchmark performed with data sizes: 218725kB, 426801kB, 634877kB, 842953kB.
Each data size is tested 10 times, hence the first 10 entries on the x-axis correspond to the 10 runs for the first data size of 218725kB and so on.
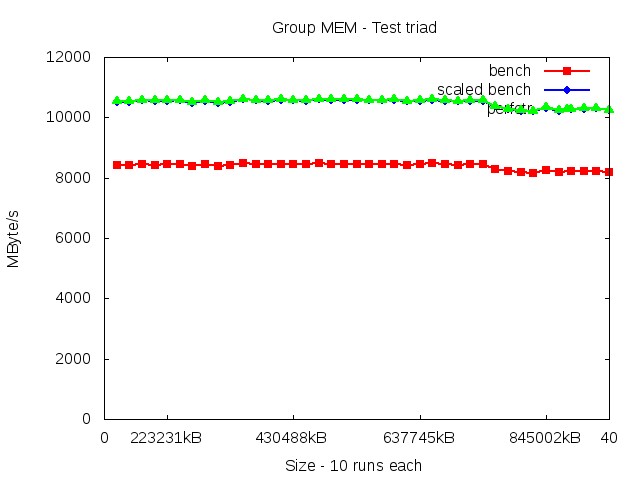
The table contains the values after scaling the original values up using the scaling factor 1.25. The table entries for BENCH and LIKWID have the unit 'MByte/s'
| Variant | BENCH (Min) | LIKWID (Min) | Error (Min) | BENCH (Max) | LIKWID (Max) | Error (Max) | BENCH (Avg) | LIKWID (Avg) | Error (Avg) |
|---|---|---|---|---|---|---|---|---|---|
| 218725kB | 10491.25 | 10504.13 | 0.12% | 10516.25 | 10535.37 | 0.18% | 10530.50 | 10545.15 | 0.14% |
| 426801kB | 10551.25 | 10564.20 | 0.12% | 10570.00 | 10600.16 | 0.29% | 10576.50 | 10592.66 | 0.15% |
| 634877kB | 10588.75 | 10602.01 | 0.13% | 10536.25 | 10553.70 | 0.17% | 10558.88 | 10574.00 | 0.14% |
| 842953kB | 10212.50 | 10225.26 | 0.12% | 10313.75 | 10330.98 | 0.17% | 10267.38 | 10282.61 | 0.15% |
Benchmark performed with data sizes: 218725kB, 426801kB, 634877kB, 842953kB.
Each data size is tested 10 times, hence the first 10 entries on the x-axis correspond to the 10 runs for the first data size of 218725kB and so on.
The table contains the values after scaling the original values up using the scaling factor 1.00. The table entries for BENCH and LIKWID have the unit 'MByte/s'
| Variant | BENCH (Min) | LIKWID (Min) | Error (Min) | BENCH (Max) | LIKWID (Max) | Error (Max) | BENCH (Avg) | LIKWID (Avg) | Error (Avg) |
|---|---|---|---|---|---|---|---|---|---|
| 218725kB | 10700.00 | 10716.52 | 0.15% | 10703.00 | 10723.83 | 0.19% | 10700.00 | 10718.55 | 0.17% |
| 426801kB | 10683.00 | 10699.45 | 0.15% | 10678.00 | 10706.08 | 0.26% | 10678.60 | 10697.52 | 0.18% |
| 634877kB | 10696.00 | 10712.25 | 0.15% | 10703.00 | 10731.29 | 0.26% | 10702.50 | 10722.00 | 0.18% |
| 842953kB | 10650.00 | 10665.73 | 0.15% | 10586.00 | 10606.00 | 0.19% | 10630.30 | 10648.10 | 0.17% |
Benchmark performed with data sizes: 218725kB, 426801kB, 634877kB, 842953kB.
Each data size is tested 10 times, hence the first 10 entries on the x-axis correspond to the 10 runs for the first data size of 218725kB and so on.
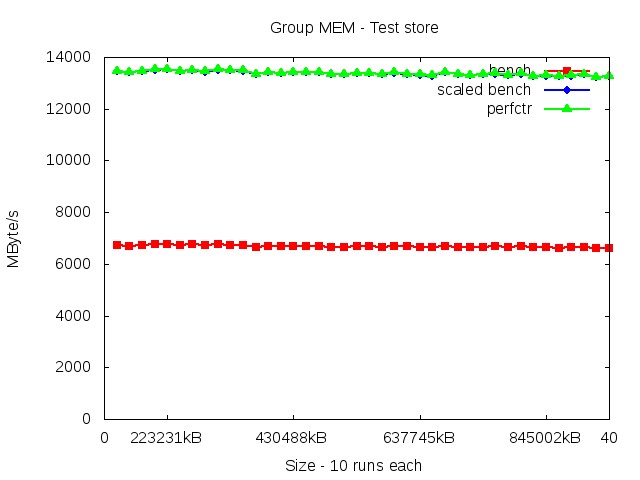
The table contains the values after scaling the original values up using the scaling factor 2.00. The table entries for BENCH and LIKWID have the unit 'MByte/s'
| Variant | BENCH (Min) | LIKWID (Min) | Error (Min) | BENCH (Max) | LIKWID (Max) | Error (Max) | BENCH (Avg) | LIKWID (Avg) | Error (Avg) |
|---|---|---|---|---|---|---|---|---|---|
| 218725kB | 13410.00 | 13423.79 | 0.10% | 13500.00 | 13518.14 | 0.13% | 13472.40 | 13488.70 | 0.12% |
| 426801kB | 13380.00 | 13393.49 | 0.10% | 13474.00 | 13508.45 | 0.26% | 13388.20 | 13405.13 | 0.13% |
| 634877kB | 13306.00 | 13319.94 | 0.10% | 13310.00 | 13329.72 | 0.15% | 13340.80 | 13356.84 | 0.12% |
| 842953kB | 13348.00 | 13362.24 | 0.11% | 13342.00 | 13360.58 | 0.14% | 13290.80 | 13306.68 | 0.12% |
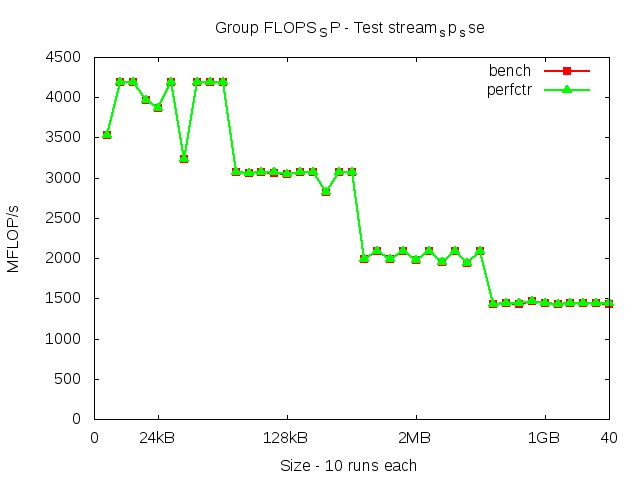
Benchmark performed with data sizes: 24kB, 128kB, 2MB, 1GB.
Each data size is tested 10 times, hence the first 10 entries on the x-axis correspond to the 10 runs for the first data size of 24kB and so on.
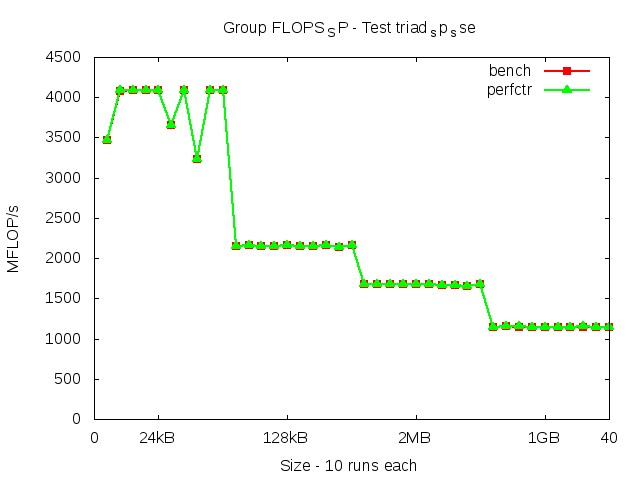
The table contains the values after scaling the original values up using the scaling factor 1.00. The table entries for BENCH and LIKWID have the unit 'MFLOP/s'
| Variant | BENCH (Min) | LIKWID (Min) | Error (Min) | BENCH (Max) | LIKWID (Max) | Error (Max) | BENCH (Avg) | LIKWID (Avg) | Error (Avg) |
|---|---|---|---|---|---|---|---|---|---|
| 24kB | 3464.00 | 3464.19 | 0.01% | 4085.00 | 4085.94 | 0.02% | 3894.80 | 3895.49 | 0.02% |
| 128kB | 2165.00 | 2165.46 | 0.02% | 2145.00 | 2146.19 | 0.06% | 2153.00 | 2153.93 | 0.04% |
| 2MB | 1674.00 | 1674.04 | 0.00% | 1669.00 | 1670.01 | 0.06% | 1670.70 | 1671.18 | 0.03% |
| 1GB | 1149.00 | 1150.36 | 0.12% | 1148.00 | 1150.21 | 0.19% | 1145.20 | 1147.07 | 0.16% |
Benchmark performed with data sizes: 24kB, 128kB, 2MB, 1GB.
Each data size is tested 10 times, hence the first 10 entries on the x-axis correspond to the 10 runs for the first data size of 24kB and so on.
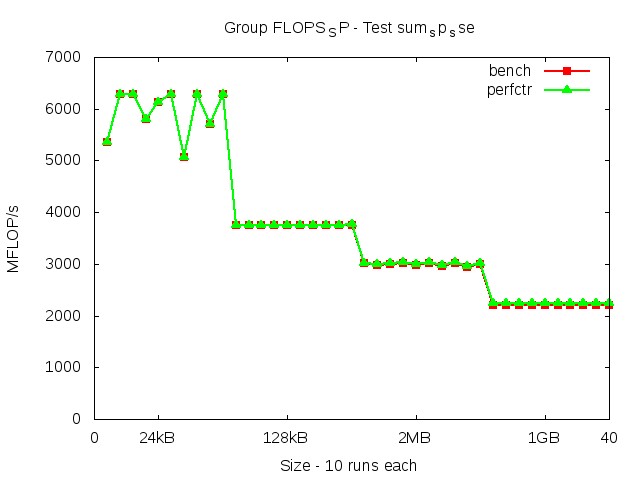
The table contains the values after scaling the original values up using the scaling factor 1.00. The table entries for BENCH and LIKWID have the unit 'MFLOP/s'
| Variant | BENCH (Min) | LIKWID (Min) | Error (Min) | BENCH (Max) | LIKWID (Max) | Error (Max) | BENCH (Avg) | LIKWID (Avg) | Error (Avg) |
|---|---|---|---|---|---|---|---|---|---|
| 24kB | 6284.00 | 6284.07 | 0.00% | 5710.00 | 5710.94 | 0.02% | 5946.20 | 5946.74 | 0.01% |
| 128kB | 3758.00 | 3758.34 | 0.01% | 3760.00 | 3761.48 | 0.04% | 3756.80 | 3757.84 | 0.03% |
| 2MB | 2948.00 | 2953.98 | 0.20% | 3010.00 | 3025.60 | 0.52% | 2993.50 | 3006.36 | 0.43% |
| 1GB | 2211.00 | 2244.64 | 1.52% | 2211.00 | 2245.07 | 1.54% | 2211.00 | 2244.86 | 1.53% |
Benchmark performed with data sizes: 24kB, 128kB, 2MB, 1GB.
Each data size is tested 10 times, hence the first 10 entries on the x-axis correspond to the 10 runs for the first data size of 24kB and so on.
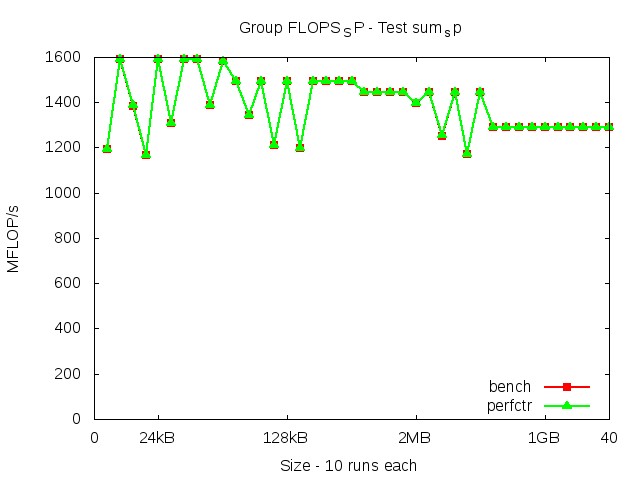
The table contains the values after scaling the original values up using the scaling factor 1.00. The table entries for BENCH and LIKWID have the unit 'MFLOP/s'
| Variant | BENCH (Min) | LIKWID (Min) | Error (Min) | BENCH (Max) | LIKWID (Max) | Error (Max) | BENCH (Avg) | LIKWID (Avg) | Error (Avg) |
|---|---|---|---|---|---|---|---|---|---|
| 24kB | 1592.00 | 1592.02 | 0.00% | 1192.00 | 1192.96 | 0.08% | 1438.80 | 1439.22 | 0.03% |
| 128kB | 1210.00 | 1210.08 | 0.01% | 1492.00 | 1493.03 | 0.07% | 1419.70 | 1420.44 | 0.05% |
| 2MB | 1398.00 | 1398.11 | 0.01% | 1444.00 | 1444.92 | 0.06% | 1393.30 | 1393.88 | 0.04% |
| 1GB | 1290.00 | 1290.79 | 0.06% | 1289.00 | 1290.41 | 0.11% | 1289.90 | 1290.87 | 0.07% |
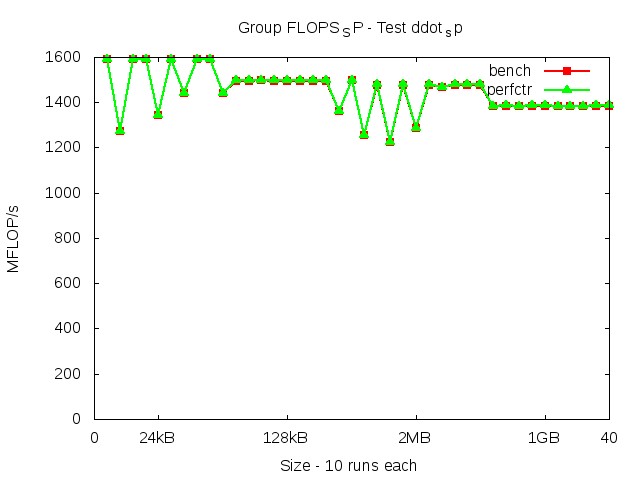
Benchmark performed with data sizes: 24kB, 128kB, 2MB, 1GB.
Each data size is tested 10 times, hence the first 10 entries on the x-axis correspond to the 10 runs for the first data size of 24kB and so on.
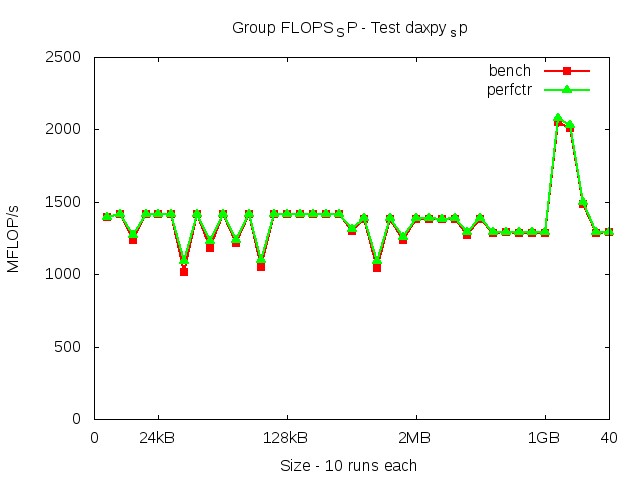
The table contains the values after scaling the original values up using the scaling factor 1.00. The table entries for BENCH and LIKWID have the unit 'MFLOP/s'
| Variant | BENCH (Min) | LIKWID (Min) | Error (Min) | BENCH (Max) | LIKWID (Max) | Error (Max) | BENCH (Avg) | LIKWID (Avg) | Error (Avg) |
|---|---|---|---|---|---|---|---|---|---|
| 24kB | 1415.00 | 1415.02 | 0.00% | 1013.00 | 1089.28 | 7.53% | 1331.00 | 1347.20 | 1.46% |
| 128kB | 1414.00 | 1414.05 | 0.00% | 1049.00 | 1096.01 | 4.48% | 1345.10 | 1354.10 | 0.79% |
| 2MB | 1383.00 | 1385.50 | 0.18% | 1041.00 | 1089.12 | 4.62% | 1322.90 | 1333.66 | 0.92% |
| 1GB | 1283.00 | 1289.32 | 0.49% | 2054.00 | 2079.42 | 1.24% | 1453.80 | 1464.44 | 0.67% |
Benchmark performed with data sizes: 24kB, 128kB, 2MB, 1GB.
Each data size is tested 10 times, hence the first 10 entries on the x-axis correspond to the 10 runs for the first data size of 24kB and so on.
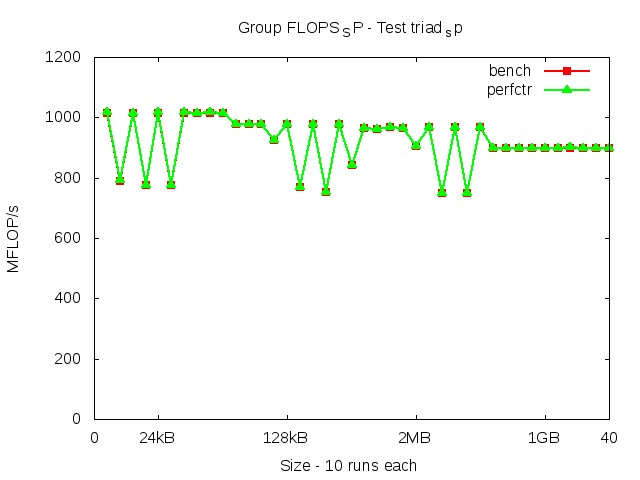
The table contains the values after scaling the original values up using the scaling factor 1.00. The table entries for BENCH and LIKWID have the unit 'MFLOP/s'
| Variant | BENCH (Min) | LIKWID (Min) | Error (Min) | BENCH (Max) | LIKWID (Max) | Error (Max) | BENCH (Avg) | LIKWID (Avg) | Error (Avg) |
|---|---|---|---|---|---|---|---|---|---|
| 24kB | 1016.00 | 1016.11 | 0.01% | 1015.00 | 1016.06 | 0.10% | 944.80 | 945.67 | 0.09% |
| 128kB | 924.00 | 924.14 | 0.02% | 978.00 | 979.08 | 0.11% | 915.80 | 916.30 | 0.06% |
| 2MB | 965.00 | 965.07 | 0.01% | 965.00 | 965.86 | 0.09% | 916.60 | 917.00 | 0.04% |
| 1GB | 899.00 | 899.53 | 0.06% | 898.00 | 899.22 | 0.14% | 898.60 | 899.51 | 0.10% |
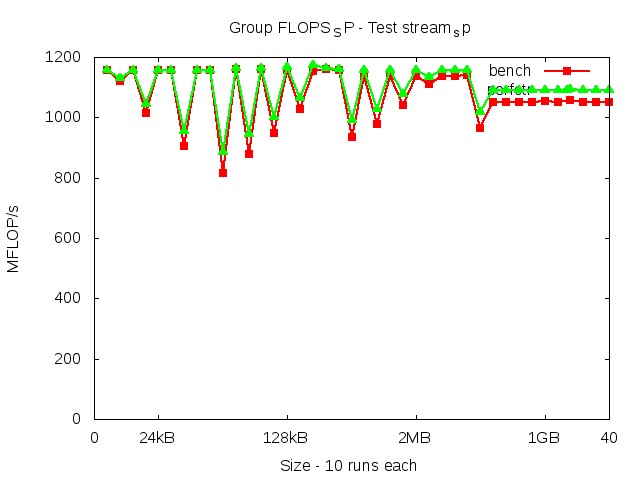
Benchmark performed with data sizes: 24kB, 128kB, 2MB, 1GB.
Each data size is tested 10 times, hence the first 10 entries on the x-axis correspond to the 10 runs for the first data size of 24kB and so on.
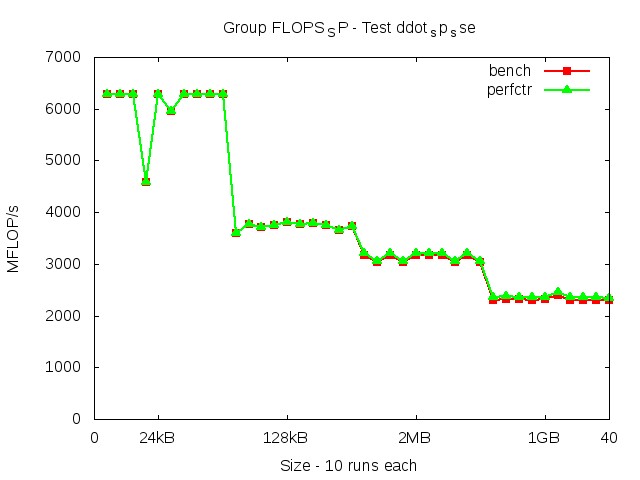
The table contains the values after scaling the original values up using the scaling factor 1.00. The table entries for BENCH and LIKWID have the unit 'MFLOP/s'
| Variant | BENCH (Min) | LIKWID (Min) | Error (Min) | BENCH (Max) | LIKWID (Max) | Error (Max) | BENCH (Avg) | LIKWID (Avg) | Error (Avg) |
|---|---|---|---|---|---|---|---|---|---|
| 24kB | 6284.00 | 6284.40 | 0.01% | 6282.00 | 6282.93 | 0.01% | 6081.60 | 6082.36 | 0.01% |
| 128kB | 3768.00 | 3768.10 | 0.00% | 3653.00 | 3662.59 | 0.26% | 3732.50 | 3734.29 | 0.05% |
| 2MB | 3034.00 | 3045.68 | 0.38% | 3165.00 | 3206.35 | 1.31% | 3112.90 | 3142.57 | 0.94% |
| 1GB | 2402.00 | 2448.41 | 1.93% | 2295.00 | 2349.20 | 2.36% | 2316.40 | 2368.93 | 2.27% |
Benchmark performed with data sizes: 24kB, 128kB, 2MB, 1GB.
Each data size is tested 10 times, hence the first 10 entries on the x-axis correspond to the 10 runs for the first data size of 24kB and so on.
The table contains the values after scaling the original values up using the scaling factor 1.00. The table entries for BENCH and LIKWID have the unit 'MFLOP/s'
| Variant | BENCH (Min) | LIKWID (Min) | Error (Min) | BENCH (Max) | LIKWID (Max) | Error (Max) | BENCH (Avg) | LIKWID (Avg) | Error (Avg) |
|---|---|---|---|---|---|---|---|---|---|
| 24kB | 4192.00 | 4192.21 | 0.00% | 4192.00 | 4192.81 | 0.02% | 3975.20 | 3975.69 | 0.01% |
| 128kB | 3047.00 | 3047.13 | 0.00% | 2821.00 | 2821.86 | 0.03% | 3040.30 | 3040.86 | 0.02% |
| 2MB | 1995.00 | 1995.03 | 0.00% | 1940.00 | 1940.97 | 0.05% | 2030.10 | 2030.47 | 0.02% |
| 1GB | 1435.00 | 1436.65 | 0.11% | 1470.00 | 1472.43 | 0.17% | 1439.40 | 1441.42 | 0.14% |
Benchmark performed with data sizes: 24kB, 128kB, 2MB, 1GB.
Each data size is tested 10 times, hence the first 10 entries on the x-axis correspond to the 10 runs for the first data size of 24kB and so on.
The table contains the values after scaling the original values up using the scaling factor 1.00. The table entries for BENCH and LIKWID have the unit 'MFLOP/s'
| Variant | BENCH (Min) | LIKWID (Min) | Error (Min) | BENCH (Max) | LIKWID (Max) | Error (Max) | BENCH (Avg) | LIKWID (Avg) | Error (Avg) |
|---|---|---|---|---|---|---|---|---|---|
| 24kB | 1271.00 | 1271.19 | 0.01% | 1442.00 | 1442.97 | 0.07% | 1504.10 | 1504.63 | 0.03% |
| 128kB | 1497.00 | 1497.09 | 0.01% | 1360.00 | 1360.94 | 0.07% | 1482.60 | 1483.24 | 0.04% |
| 2MB | 1254.00 | 1254.64 | 0.05% | 1478.00 | 1479.53 | 0.10% | 1409.70 | 1410.83 | 0.08% |
| 1GB | 1384.00 | 1385.05 | 0.08% | 1383.00 | 1384.99 | 0.14% | 1383.90 | 1385.49 | 0.11% |
Benchmark performed with data sizes: 24kB, 128kB, 2MB, 1GB.
Each data size is tested 10 times, hence the first 10 entries on the x-axis correspond to the 10 runs for the first data size of 24kB and so on.
The table contains the values after scaling the original values up using the scaling factor 1.00. The table entries for BENCH and LIKWID have the unit 'MFLOP/s'
| Variant | BENCH (Min) | LIKWID (Min) | Error (Min) | BENCH (Max) | LIKWID (Max) | Error (Max) | BENCH (Avg) | LIKWID (Avg) | Error (Avg) |
|---|---|---|---|---|---|---|---|---|---|
| 24kB | 1156.00 | 1156.99 | 0.09% | 815.00 | 883.44 | 8.40% | 1079.10 | 1095.53 | 1.83% |
| 128kB | 1159.00 | 1162.60 | 0.31% | 877.00 | 943.73 | 7.61% | 1073.00 | 1098.52 | 2.65% |
| 2MB | 1138.00 | 1156.82 | 1.65% | 966.00 | 1016.77 | 5.26% | 1092.10 | 1119.97 | 2.63% |
| 1GB | 1056.00 | 1093.85 | 3.58% | 1050.00 | 1089.70 | 3.78% | 1051.60 | 1090.49 | 3.70% |
Benchmark performed with data sizes: 24kB, 128kB, 2MB, 1GB.
Each data size is tested 10 times, hence the first 10 entries on the x-axis correspond to the 10 runs for the first data size of 24kB and so on.
The table contains the values after scaling the original values up using the scaling factor 1.00. The table entries for BENCH and LIKWID have the unit 'MFLOP/s'
| Variant | BENCH (Min) | LIKWID (Min) | Error (Min) | BENCH (Max) | LIKWID (Max) | Error (Max) | BENCH (Avg) | LIKWID (Avg) | Error (Avg) |
|---|---|---|---|---|---|---|---|---|---|
| 24kB | 0.00 | 0.00 | 0.00% | 0.00 | 0.00 | 0.00% | 0.00 | 0.00 | 0.00% |
| 128kB | 0.00 | 0.00 | 0.00% | 0.00 | 0.00 | 0.00% | 0.00 | 0.00 | 0.00% |
| 2MB | 0.00 | 0.00 | 0.00% | 0.00 | 0.00 | 0.00% | 0.00 | 0.00 | 0.00% |
| 1GB | 0.00 | 0.00 | 0.00% | 0.00 | 0.00 | 0.00% | 0.00 | 0.00 | 0.00% |
Benchmark performed with data sizes: 85kB, 129kB, 173kB, 217kB.
Each data size is tested 5 times, hence the first 5 entries on the x-axis correspond to the 5 runs for the first data size of 85kB and so on.
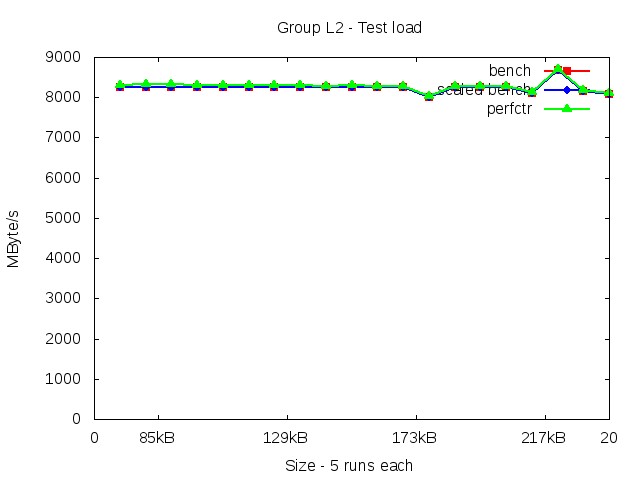
The table contains the values after scaling the original values up using the scaling factor 1.00. The table entries for BENCH and LIKWID have the unit 'MByte/s'
| Variant | BENCH (Min) | LIKWID (Min) | Error (Min) | BENCH (Max) | LIKWID (Max) | Error (Max) | BENCH (Avg) | LIKWID (Avg) | Error (Avg) |
|---|---|---|---|---|---|---|---|---|---|
| 85kB | 8259.00 | 8316.83 | 0.70% | 8259.00 | 8317.40 | 0.71% | 8253.80 | 8311.89 | 0.70% |
| 129kB | 8255.00 | 8293.67 | 0.47% | 8252.00 | 8291.25 | 0.48% | 8254.80 | 8293.80 | 0.47% |
| 173kB | 8012.00 | 8040.37 | 0.35% | 8244.00 | 8273.64 | 0.36% | 8200.00 | 8229.25 | 0.36% |
| 217kB | 8675.00 | 8696.14 | 0.24% | 8086.00 | 8109.80 | 0.29% | 8254.20 | 8277.05 | 0.28% |
Benchmark performed with data sizes: 85kB, 129kB, 173kB, 217kB.
Each data size is tested 5 times, hence the first 5 entries on the x-axis correspond to the 5 runs for the first data size of 85kB and so on.
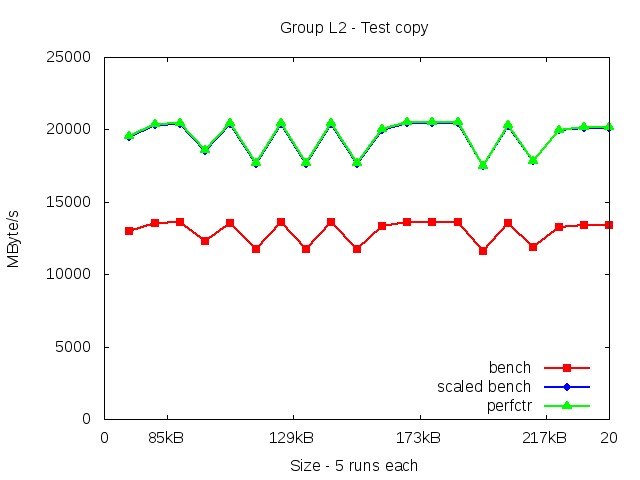
The table contains the values after scaling the original values up using the scaling factor 1.50. The table entries for BENCH and LIKWID have the unit 'MByte/s'
| Variant | BENCH (Min) | LIKWID (Min) | Error (Min) | BENCH (Max) | LIKWID (Max) | Error (Max) | BENCH (Avg) | LIKWID (Avg) | Error (Avg) |
|---|---|---|---|---|---|---|---|---|---|
| 85kB | 18489.00 | 18546.37 | 0.31% | 20373.00 | 20455.93 | 0.41% | 19797.30 | 19873.07 | 0.38% |
| 129kB | 17610.00 | 17661.64 | 0.29% | 20395.50 | 20460.55 | 0.32% | 18718.20 | 18776.66 | 0.31% |
| 173kB | 17445.00 | 17486.06 | 0.24% | 20455.50 | 20504.62 | 0.24% | 19747.80 | 19794.84 | 0.24% |
| 217kB | 17788.50 | 17817.79 | 0.16% | 20115.00 | 20148.30 | 0.17% | 19643.40 | 19675.39 | 0.16% |
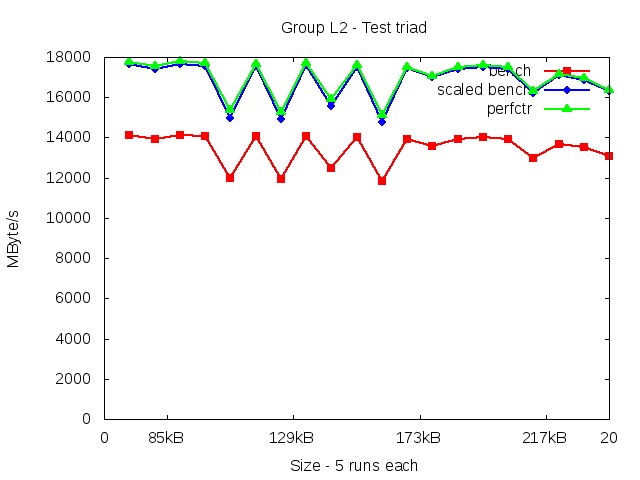
Benchmark performed with data sizes: 85kB, 129kB, 173kB, 217kB.
Each data size is tested 5 times, hence the first 5 entries on the x-axis correspond to the 5 runs for the first data size of 85kB and so on.
The table contains the values after scaling the original values up using the scaling factor 1.33. The table entries for BENCH and LIKWID have the unit 'MByte/s'
| Variant | BENCH (Min) | LIKWID (Min) | Error (Min) | BENCH (Max) | LIKWID (Max) | Error (Max) | BENCH (Avg) | LIKWID (Avg) | Error (Avg) |
|---|---|---|---|---|---|---|---|---|---|
| 85kB | 17378.23 | 17502.00 | 0.71% | 16354.26 | 16498.36 | 0.88% | 16922.51 | 17054.40 | 0.78% |
| 129kB | 17323.57 | 17418.09 | 0.55% | 16623.58 | 16728.85 | 0.63% | 17079.31 | 17179.64 | 0.59% |
| 173kB | 17395.57 | 17456.48 | 0.35% | 15420.95 | 15531.70 | 0.72% | 16692.12 | 16770.83 | 0.48% |
| 217kB | 16674.25 | 16723.59 | 0.30% | 15860.94 | 15920.95 | 0.38% | 16714.25 | 16766.24 | 0.31% |
Benchmark performed with data sizes: 85kB, 129kB, 173kB, 217kB.
Each data size is tested 5 times, hence the first 5 entries on the x-axis correspond to the 5 runs for the first data size of 85kB and so on.
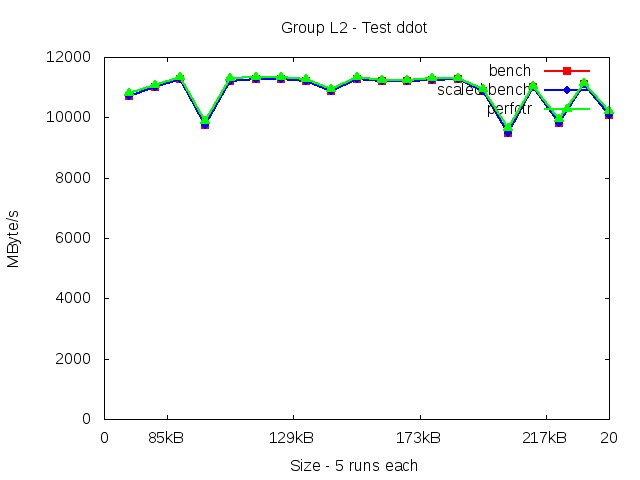
The table contains the values after scaling the original values up using the scaling factor 1.00. The table entries for BENCH and LIKWID have the unit 'MByte/s'
| Variant | BENCH (Min) | LIKWID (Min) | Error (Min) | BENCH (Max) | LIKWID (Max) | Error (Max) | BENCH (Avg) | LIKWID (Avg) | Error (Avg) |
|---|---|---|---|---|---|---|---|---|---|
| 85kB | 11217.00 | 11294.67 | 0.69% | 9756.00 | 9864.97 | 1.12% | 10789.20 | 10876.51 | 0.82% |
| 129kB | 11279.00 | 11336.82 | 0.51% | 10881.00 | 10945.25 | 0.59% | 11186.00 | 11245.15 | 0.53% |
| 173kB | 10884.00 | 10926.50 | 0.39% | 11188.00 | 11232.32 | 0.40% | 11157.00 | 11200.35 | 0.39% |
| 217kB | 11121.00 | 11152.53 | 0.28% | 9487.00 | 9647.03 | 1.69% | 10304.40 | 10404.84 | 1.01% |
Benchmark performed with data sizes: 85kB, 129kB, 173kB, 217kB.
Each data size is tested 5 times, hence the first 5 entries on the x-axis correspond to the 5 runs for the first data size of 85kB and so on.
The table contains the values after scaling the original values up using the scaling factor 1.25. The table entries for BENCH and LIKWID have the unit 'MByte/s'
| Variant | BENCH (Min) | LIKWID (Min) | Error (Min) | BENCH (Max) | LIKWID (Max) | Error (Max) | BENCH (Avg) | LIKWID (Avg) | Error (Avg) |
|---|---|---|---|---|---|---|---|---|---|
| 85kB | 17647.50 | 17775.09 | 0.72% | 14986.25 | 15382.63 | 2.64% | 17054.00 | 17236.44 | 1.12% |
| 129kB | 17526.25 | 17621.88 | 0.55% | 14917.50 | 15278.95 | 2.42% | 16637.00 | 16830.29 | 1.22% |
| 173kB | 17433.75 | 17510.60 | 0.44% | 14788.75 | 15124.95 | 2.27% | 16832.00 | 16961.64 | 0.81% |
| 217kB | 16230.00 | 16290.80 | 0.37% | 17417.50 | 17479.63 | 0.36% | 16785.75 | 16847.23 | 0.37% |
Benchmark performed with data sizes: 85kB, 129kB, 173kB, 217kB.
Each data size is tested 5 times, hence the first 5 entries on the x-axis correspond to the 5 runs for the first data size of 85kB and so on.
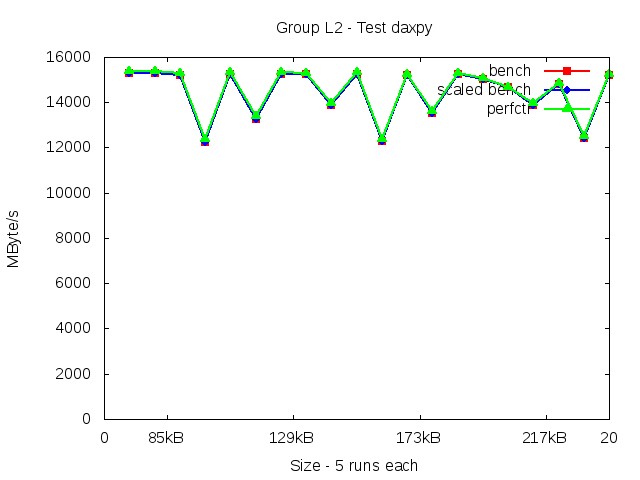
The table contains the values after scaling the original values up using the scaling factor 1.00. The table entries for BENCH and LIKWID have the unit 'MByte/s'
| Variant | BENCH (Min) | LIKWID (Min) | Error (Min) | BENCH (Max) | LIKWID (Max) | Error (Max) | BENCH (Avg) | LIKWID (Avg) | Error (Avg) |
|---|---|---|---|---|---|---|---|---|---|
| 85kB | 15282.00 | 15366.84 | 0.56% | 12243.00 | 12391.97 | 1.22% | 14651.80 | 14749.57 | 0.69% |
| 129kB | 15253.00 | 15316.34 | 0.42% | 13277.00 | 13382.16 | 0.79% | 14582.60 | 14660.68 | 0.54% |
| 173kB | 15246.00 | 15289.51 | 0.29% | 12274.00 | 12394.05 | 0.98% | 14262.40 | 14329.34 | 0.49% |
| 217kB | 15225.00 | 15259.49 | 0.23% | 12407.00 | 12512.39 | 0.85% | 14199.20 | 14254.34 | 0.40% |
Benchmark performed with data sizes: 85kB, 129kB, 173kB, 217kB.
Each data size is tested 5 times, hence the first 5 entries on the x-axis correspond to the 5 runs for the first data size of 85kB and so on.
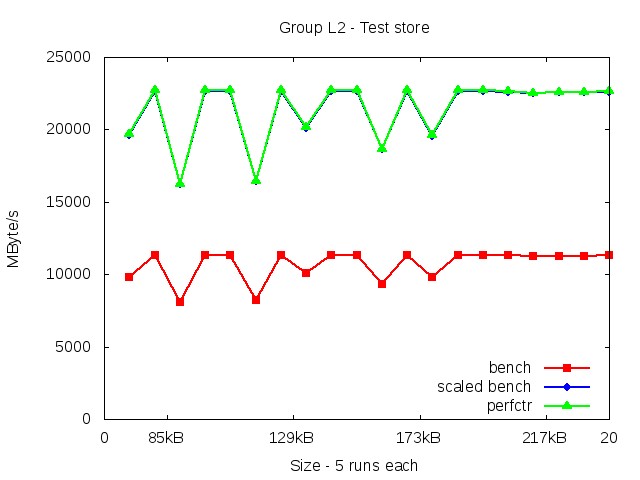
The table contains the values after scaling the original values up using the scaling factor 2.00. The table entries for BENCH and LIKWID have the unit 'MByte/s'
| Variant | BENCH (Min) | LIKWID (Min) | Error (Min) | BENCH (Max) | LIKWID (Max) | Error (Max) | BENCH (Avg) | LIKWID (Avg) | Error (Avg) |
|---|---|---|---|---|---|---|---|---|---|
| 85kB | 16202.00 | 16244.60 | 0.26% | 22634.00 | 22719.36 | 0.38% | 20743.60 | 20816.27 | 0.35% |
| 129kB | 16434.00 | 16462.01 | 0.17% | 22656.00 | 22717.20 | 0.27% | 20903.20 | 20956.29 | 0.25% |
| 173kB | 18646.00 | 18678.85 | 0.18% | 22670.00 | 22711.87 | 0.18% | 21245.60 | 21283.63 | 0.18% |
| 217kB | 22574.00 | 22609.52 | 0.16% | 22502.00 | 22538.70 | 0.16% | 22572.00 | 22608.25 | 0.16% |
Benchmark performed with data sizes: 5810kB, 11288kB, 16766kB, 22244kB.
Each data size is tested 5 times, hence the first 5 entries on the x-axis correspond to the 5 runs for the first data size of 5810kB and so on.
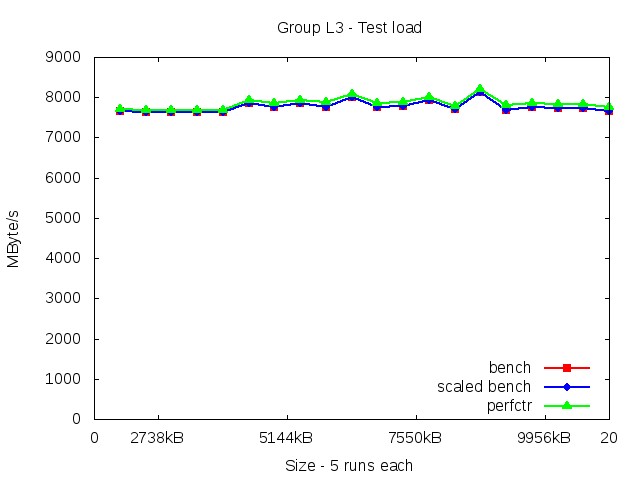
The table contains the values after scaling the original values up using the scaling factor 1.00. The table entries for BENCH and LIKWID have the unit 'MByte/s'
| Variant | BENCH (Min) | LIKWID (Min) | Error (Min) | BENCH (Max) | LIKWID (Max) | Error (Max) | BENCH (Avg) | LIKWID (Avg) | Error (Avg) |
|---|---|---|---|---|---|---|---|---|---|
| 5810kB | 7638.00 | 7677.61 | 0.52% | 7657.00 | 7699.47 | 0.55% | 7642.60 | 7683.85 | 0.54% |
| 11288kB | 7848.00 | 7918.61 | 0.90% | 7767.00 | 7868.53 | 1.31% | 7848.40 | 7936.44 | 1.12% |
| 16766kB | 8135.00 | 8194.40 | 0.73% | 7766.00 | 7867.98 | 1.31% | 7860.40 | 7945.99 | 1.09% |
| 22244kB | 7665.00 | 7760.03 | 1.24% | 7692.00 | 7807.22 | 1.50% | 7712.60 | 7818.25 | 1.37% |
Benchmark performed with data sizes: 5810kB, 11288kB, 16766kB, 22244kB.
Each data size is tested 5 times, hence the first 5 entries on the x-axis correspond to the 5 runs for the first data size of 5810kB and so on.
The table contains the values after scaling the original values up using the scaling factor 1.50. The table entries for BENCH and LIKWID have the unit 'MByte/s'
| Variant | BENCH (Min) | LIKWID (Min) | Error (Min) | BENCH (Max) | LIKWID (Max) | Error (Max) | BENCH (Avg) | LIKWID (Avg) | Error (Avg) |
|---|---|---|---|---|---|---|---|---|---|
| 5810kB | 15220.50 | 16108.84 | 5.84% | 13626.00 | 15372.52 | 12.82% | 14897.40 | 15966.65 | 7.30% |
| 11288kB | 15340.50 | 16155.28 | 5.31% | 13629.00 | 15454.71 | 13.40% | 14953.20 | 16004.64 | 7.17% |
| 16766kB | 15384.00 | 16154.40 | 5.01% | 13786.50 | 15637.00 | 13.42% | 14866.80 | 15963.25 | 7.50% |
| 22244kB | 15228.00 | 16005.96 | 5.11% | 13576.50 | 15380.93 | 13.29% | 14858.40 | 15869.71 | 6.94% |
Benchmark performed with data sizes: 5810kB, 11288kB, 16766kB, 22244kB.
Each data size is tested 5 times, hence the first 5 entries on the x-axis correspond to the 5 runs for the first data size of 5810kB and so on.
The table contains the values after scaling the original values up using the scaling factor 1.33. The table entries for BENCH and LIKWID have the unit 'MByte/s'
| Variant | BENCH (Min) | LIKWID (Min) | Error (Min) | BENCH (Max) | LIKWID (Max) | Error (Max) | BENCH (Avg) | LIKWID (Avg) | Error (Avg) |
|---|---|---|---|---|---|---|---|---|---|
| 5810kB | 12227.61 | 13587.65 | 11.12% | 13604.60 | 15566.59 | 14.42% | 13225.23 | 15025.80 | 13.57% |
| 11288kB | 12384.90 | 13815.81 | 11.55% | 13631.26 | 15634.87 | 14.70% | 13144.45 | 14926.27 | 13.49% |
| 16766kB | 13460.63 | 15311.19 | 13.75% | 13771.22 | 15769.91 | 14.51% | 13582.20 | 15518.88 | 14.26% |
| 22244kB | 13509.95 | 15498.48 | 14.72% | 13423.31 | 15464.19 | 15.20% | 13519.55 | 15527.73 | 14.85% |
Benchmark performed with data sizes: 5810kB, 11288kB, 16766kB, 22244kB.
Each data size is tested 5 times, hence the first 5 entries on the x-axis correspond to the 5 runs for the first data size of 5810kB and so on.
The table contains the values after scaling the original values up using the scaling factor 1.00. The table entries for BENCH and LIKWID have the unit 'MByte/s'
| Variant | BENCH (Min) | LIKWID (Min) | Error (Min) | BENCH (Max) | LIKWID (Max) | Error (Max) | BENCH (Avg) | LIKWID (Avg) | Error (Avg) |
|---|---|---|---|---|---|---|---|---|---|
| 5810kB | 8804.00 | 9032.11 | 2.59% | 9940.00 | 10550.25 | 6.14% | 9616.20 | 10113.85 | 5.12% |
| 11288kB | 8829.00 | 9018.82 | 2.15% | 9959.00 | 10541.21 | 5.85% | 9600.00 | 10036.67 | 4.46% |
| 16766kB | 9388.00 | 9789.07 | 4.27% | 10043.00 | 10703.53 | 6.58% | 9899.00 | 10475.21 | 5.80% |
| 22244kB | 10069.00 | 10731.42 | 6.58% | 9814.00 | 10490.47 | 6.89% | 9965.60 | 10633.72 | 6.71% |
Benchmark performed with data sizes: 5810kB, 11288kB, 16766kB, 22244kB.
Each data size is tested 5 times, hence the first 5 entries on the x-axis correspond to the 5 runs for the first data size of 5810kB and so on.
The table contains the values after scaling the original values up using the scaling factor 1.33. The table entries for BENCH and LIKWID have the unit 'MByte/s'
| Variant | BENCH (Min) | LIKWID (Min) | Error (Min) | BENCH (Max) | LIKWID (Max) | Error (Max) | BENCH (Avg) | LIKWID (Avg) | Error (Avg) |
|---|---|---|---|---|---|---|---|---|---|
| 5810kB | 13917.85 | 14802.48 | 6.36% | 14725.65 | 15734.23 | 6.85% | 14560.36 | 15538.13 | 6.71% |
| 11288kB | 13624.59 | 14488.52 | 6.34% | 14724.32 | 15715.94 | 6.73% | 14527.30 | 15490.23 | 6.62% |
| 16766kB | 13569.94 | 14409.95 | 6.19% | 13801.88 | 14985.59 | 8.58% | 14196.98 | 15185.93 | 6.97% |
| 22244kB | 14467.05 | 15529.34 | 7.34% | 14503.04 | 15636.32 | 7.81% | 14197.25 | 15285.56 | 7.68% |
Benchmark performed with data sizes: 5810kB, 11288kB, 16766kB, 22244kB.
Each data size is tested 5 times, hence the first 5 entries on the x-axis correspond to the 5 runs for the first data size of 5810kB and so on.
The table contains the values after scaling the original values up using the scaling factor 1.00. The table entries for BENCH and LIKWID have the unit 'MByte/s'
| Variant | BENCH (Min) | LIKWID (Min) | Error (Min) | BENCH (Max) | LIKWID (Max) | Error (Max) | BENCH (Avg) | LIKWID (Avg) | Error (Avg) |
|---|---|---|---|---|---|---|---|---|---|
| 5810kB | 10735.00 | 11644.87 | 8.48% | 12145.00 | 13573.67 | 11.76% | 11718.20 | 12981.12 | 10.72% |
| 11288kB | 10561.00 | 11382.90 | 7.78% | 12334.00 | 13766.79 | 11.62% | 11286.80 | 12365.04 | 9.43% |
| 16766kB | 10652.00 | 11493.86 | 7.90% | 12289.00 | 13721.41 | 11.66% | 11653.00 | 12847.70 | 10.13% |
| 22244kB | 12040.00 | 13384.03 | 11.16% | 12188.00 | 13601.32 | 11.60% | 12245.40 | 13640.20 | 11.39% |
Benchmark performed with data sizes: 5810kB, 11288kB, 16766kB, 22244kB.
Each data size is tested 5 times, hence the first 5 entries on the x-axis correspond to the 5 runs for the first data size of 5810kB and so on.
The table contains the values after scaling the original values up using the scaling factor 2.00. The table entries for BENCH and LIKWID have the unit 'MByte/s'
| Variant | BENCH (Min) | LIKWID (Min) | Error (Min) | BENCH (Max) | LIKWID (Max) | Error (Max) | BENCH (Avg) | LIKWID (Avg) | Error (Avg) |
|---|---|---|---|---|---|---|---|---|---|
| 5810kB | 20288.00 | 18529.09 | -8.67% | 20786.00 | 18661.97 | -10.22% | 20585.60 | 18612.46 | -9.58% |
| 11288kB | 20498.00 | 18587.51 | -9.32% | 20790.00 | 18682.84 | -10.14% | 20554.40 | 18594.74 | -9.53% |
| 16766kB | 20498.00 | 18523.26 | -9.63% | 20794.00 | 18678.21 | -10.17% | 20687.60 | 18630.08 | -9.94% |
| 22244kB | 19560.00 | 17725.08 | -9.38% | 20738.00 | 18631.23 | -10.16% | 20168.40 | 18194.77 | -9.78% |
Benchmark performed with data sizes: 12kB, 1MB, 4MB, 1GB.
Each data size is tested 5 times, hence the first 5 entries on the x-axis correspond to the 5 runs for the first data size of 12kB and so on.
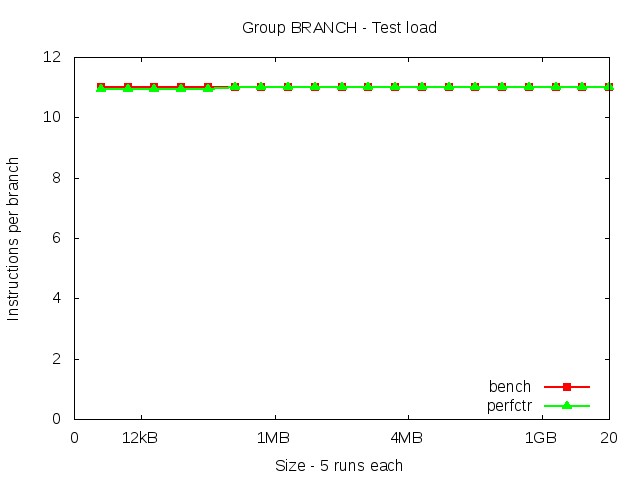
The table contains the values after scaling the original values up using the scaling factor 11.00. The table entries for BENCH and LIKWID have the unit 'Instructions per branch'
| Variant | BENCH (Min) | LIKWID (Min) | Error (Min) | BENCH (Max) | LIKWID (Max) | Error (Max) | BENCH (Avg) | LIKWID (Avg) | Error (Avg) |
|---|---|---|---|---|---|---|---|---|---|
| 12kB | 11.00 | 10.95 | -0.43% | 11.00 | 10.95 | -0.43% | 11.00 | 10.95 | -0.43% |
| 1MB | 11.00 | 11.00 | -0.01% | 11.00 | 11.00 | -0.01% | 11.00 | 11.00 | -0.01% |
| 4MB | 11.00 | 11.00 | 0.00% | 11.00 | 11.00 | 0.00% | 11.00 | 11.00 | 0.00% |
| 1GB | 11.00 | 11.00 | 0.00% | 11.00 | 11.00 | 0.00% | 11.00 | 11.00 | 0.00% |
Benchmark performed with data sizes: 12kB, 1MB, 4MB, 1GB.
Each data size is tested 5 times, hence the first 5 entries on the x-axis correspond to the 5 runs for the first data size of 12kB and so on.
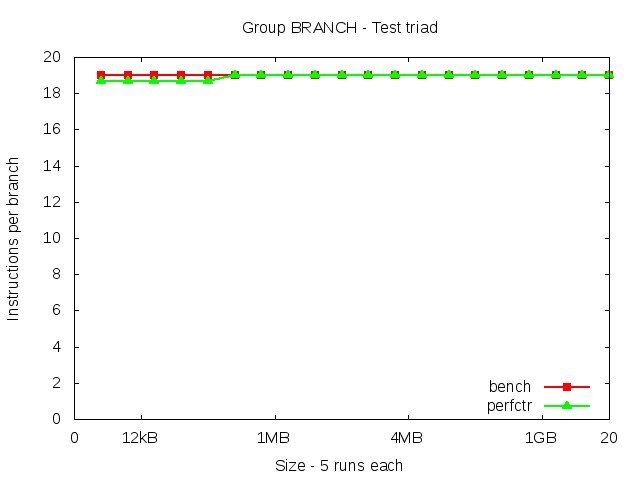
The table contains the values after scaling the original values up using the scaling factor 19.00. The table entries for BENCH and LIKWID have the unit 'Instructions per branch'
| Variant | BENCH (Min) | LIKWID (Min) | Error (Min) | BENCH (Max) | LIKWID (Max) | Error (Max) | BENCH (Avg) | LIKWID (Avg) | Error (Avg) |
|---|---|---|---|---|---|---|---|---|---|
| 12kB | 19.00 | 18.69 | -1.65% | 19.00 | 18.69 | -1.65% | 19.00 | 18.69 | -1.65% |
| 1MB | 19.00 | 19.00 | -0.02% | 19.00 | 19.00 | -0.02% | 19.00 | 19.00 | -0.02% |
| 4MB | 19.00 | 19.00 | -0.01% | 19.00 | 19.00 | -0.01% | 19.00 | 19.00 | -0.01% |
| 1GB | 19.00 | 19.00 | 0.00% | 19.00 | 19.00 | 0.00% | 19.00 | 19.00 | 0.00% |
Benchmark performed with data sizes: 12kB, 1MB, 4MB, 1GB.
Each data size is tested 5 times, hence the first 5 entries on the x-axis correspond to the 5 runs for the first data size of 12kB and so on.
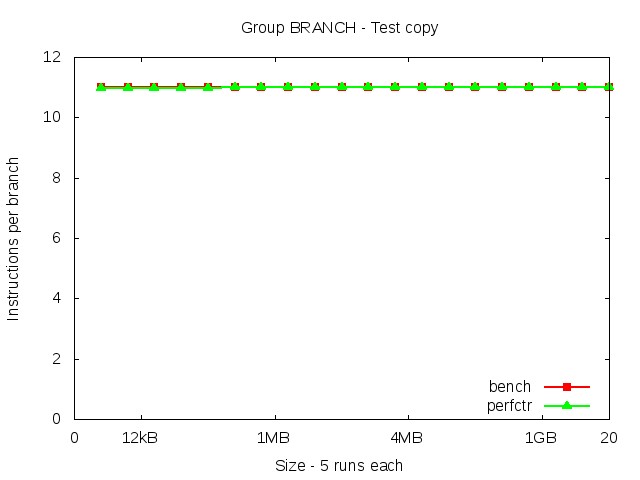
The table contains the values after scaling the original values up using the scaling factor 11.00. The table entries for BENCH and LIKWID have the unit 'Instructions per branch'
| Variant | BENCH (Min) | LIKWID (Min) | Error (Min) | BENCH (Max) | LIKWID (Max) | Error (Max) | BENCH (Avg) | LIKWID (Avg) | Error (Avg) |
|---|---|---|---|---|---|---|---|---|---|
| 12kB | 11.00 | 10.96 | -0.38% | 11.00 | 10.96 | -0.38% | 11.00 | 10.96 | -0.38% |
| 1MB | 11.00 | 11.00 | -0.01% | 11.00 | 11.00 | -0.01% | 11.00 | 11.00 | -0.01% |
| 4MB | 11.00 | 11.00 | 0.00% | 11.00 | 11.00 | 0.00% | 11.00 | 11.00 | 0.00% |
| 1GB | 11.00 | 11.00 | 0.00% | 11.00 | 11.00 | 0.00% | 11.00 | 11.00 | 0.00% |
Benchmark performed with data sizes: 12kB, 1MB, 4MB, 1GB.
Each data size is tested 5 times, hence the first 5 entries on the x-axis correspond to the 5 runs for the first data size of 12kB and so on.
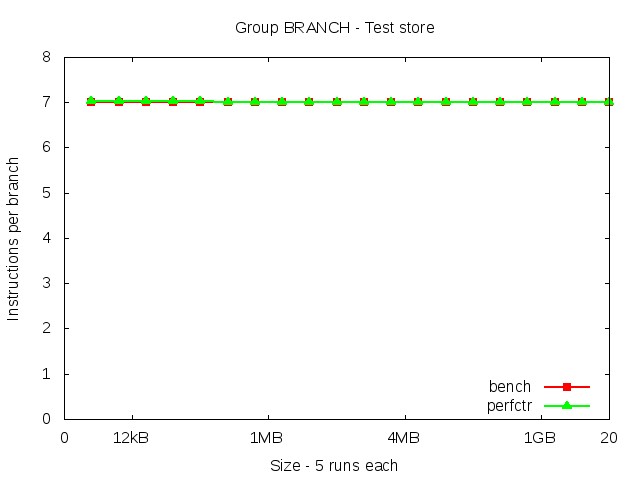
The table contains the values after scaling the original values up using the scaling factor 7.00. The table entries for BENCH and LIKWID have the unit 'Instructions per branch'
| Variant | BENCH (Min) | LIKWID (Min) | Error (Min) | BENCH (Max) | LIKWID (Max) | Error (Max) | BENCH (Avg) | LIKWID (Avg) | Error (Avg) |
|---|---|---|---|---|---|---|---|---|---|
| 12kB | 7.00 | 7.02 | 0.26% | 7.00 | 7.02 | 0.26% | 7.00 | 7.02 | 0.26% |
| 1MB | 7.00 | 7.00 | 0.00% | 7.00 | 7.00 | 0.00% | 7.00 | 7.00 | 0.00% |
| 4MB | 7.00 | 7.00 | 0.00% | 0.00 | 0.00 | 0.00% | 7.00 | 7.00 | 0.00% |
| 1GB | 7.00 | 7.00 | 0.00% | 0.00 | 0.00 | 0.00% | 7.00 | 7.00 | 0.00% |
Benchmark performed with data sizes: 12kB, 1MB, 4MB, 1GB.
Each data size is tested 5 times, hence the first 5 entries on the x-axis correspond to the 5 runs for the first data size of 12kB and so on.
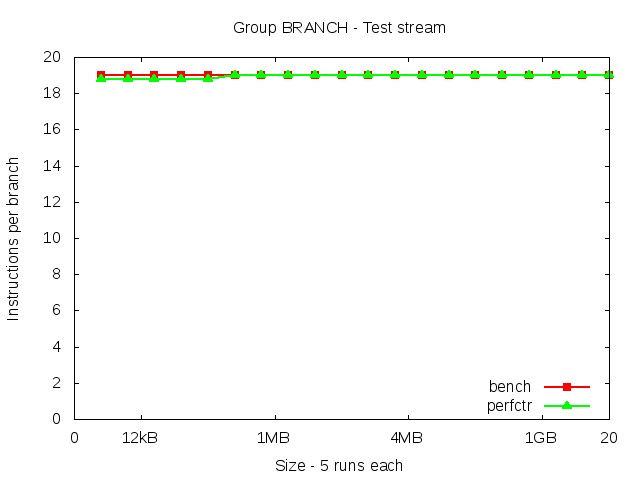
The table contains the values after scaling the original values up using the scaling factor 19.00. The table entries for BENCH and LIKWID have the unit 'Instructions per branch'
| Variant | BENCH (Min) | LIKWID (Min) | Error (Min) | BENCH (Max) | LIKWID (Max) | Error (Max) | BENCH (Avg) | LIKWID (Avg) | Error (Avg) |
|---|---|---|---|---|---|---|---|---|---|
| 12kB | 19.00 | 18.77 | -1.19% | 19.00 | 18.77 | -1.19% | 19.00 | 18.77 | -1.19% |
| 1MB | 19.00 | 19.00 | -0.02% | 19.00 | 19.00 | -0.02% | 19.00 | 19.00 | -0.02% |
| 4MB | 19.00 | 19.00 | 0.00% | 19.00 | 19.00 | 0.00% | 19.00 | 19.00 | 0.00% |
| 1GB | 19.00 | 19.00 | 0.00% | 19.00 | 19.00 | 0.00% | 19.00 | 19.00 | 0.00% |
Benchmark performed with data sizes: 223231kB, 430488kB, 637745kB, 845002kB.
Each data size is tested 5 times, hence the first 5 entries on the x-axis correspond to the 5 runs for the first data size of 223231kB and so on.
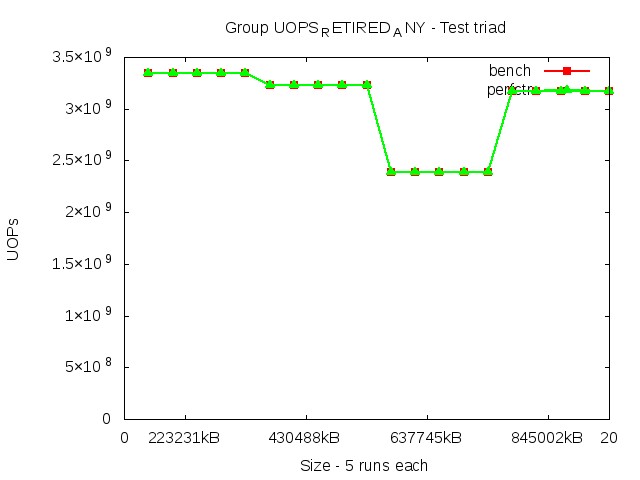
The table contains the values after scaling the original values up using the scaling factor 1.00. The table entries for BENCH and LIKWID have the unit 'Micro Ops'
| Variant | BENCH (Min) | LIKWID (Min) | Error (Min) | BENCH (Max) | LIKWID (Max) | Error (Max) | BENCH (Avg) | LIKWID (Avg) | Error (Avg) |
|---|---|---|---|---|---|---|---|---|---|
| 223231kB | 3348464640.00 | 3349715000.00 | 0.04% | 3348464640.00 | 3349741000.00 | 0.04% | 3348464640.00 | 3349725600.00 | 0.04% |
| 430488kB | 3228659520.00 | 3229853000.00 | 0.04% | 3228659520.00 | 3229909000.00 | 0.04% | 3228659520.00 | 3229874000.00 | 0.04% |
| 637745kB | 2391543360.00 | 2392434000.00 | 0.04% | 2391543360.00 | 2392504000.00 | 0.04% | 2391543360.00 | 2392455200.00 | 0.04% |
| 845002kB | 3168757440.00 | 3169982000.00 | 0.04% | 3168757440.00 | 3170002000.00 | 0.04% | 3168757440.00 | 3169994600.00 | 0.04% |
Benchmark performed with data sizes: 223231kB, 430488kB, 637745kB, 845002kB.
Each data size is tested 5 times, hence the first 5 entries on the x-axis correspond to the 5 runs for the first data size of 223231kB and so on.
The table contains the values after scaling the original values up using the scaling factor 1.00. The table entries for BENCH and LIKWID have the unit 'Micro Ops'
| Variant | BENCH (Min) | LIKWID (Min) | Error (Min) | BENCH (Max) | LIKWID (Max) | Error (Max) | BENCH (Avg) | LIKWID (Avg) | Error (Avg) |
|---|---|---|---|---|---|---|---|---|---|
| 223231kB | 2902002688.00 | 2902668000.00 | 0.02% | 5804005376.00 | 5805314000.00 | 0.02% | 3482403225.60 | 3483204200.00 | 0.02% |
| 430488kB | 5596344000.00 | 5597608000.00 | 0.02% | 5596344000.00 | 5597641000.00 | 0.02% | 5596344000.00 | 5597621400.00 | 0.02% |
| 637745kB | 4145342240.00 | 4146269000.00 | 0.02% | 4145342240.00 | 4146360000.00 | 0.02% | 4145342240.00 | 4146299200.00 | 0.02% |
| 845002kB | 5492512896.00 | 5493760000.00 | 0.02% | 5492512896.00 | 5493784000.00 | 0.02% | 5492512896.00 | 5493770600.00 | 0.02% |
Benchmark performed with data sizes: 223231kB, 430488kB, 637745kB, 845002kB.
Each data size is tested 5 times, hence the first 5 entries on the x-axis correspond to the 5 runs for the first data size of 223231kB and so on.
The table contains the values after scaling the original values up using the scaling factor 1.00. The table entries for BENCH and LIKWID have the unit 'Micro Ops'
| Variant | BENCH (Min) | LIKWID (Min) | Error (Min) | BENCH (Max) | LIKWID (Max) | Error (Max) | BENCH (Avg) | LIKWID (Avg) | Error (Avg) |
|---|---|---|---|---|---|---|---|---|---|
| 223231kB | 4018157568.00 | 4019199000.00 | 0.03% | 4018157568.00 | 4019221000.00 | 0.03% | 4018157568.00 | 4019212000.00 | 0.03% |
| 430488kB | 3874392000.00 | 3875415000.00 | 0.03% | 3874392000.00 | 3875444000.00 | 0.03% | 3874392000.00 | 3875427400.00 | 0.03% |
| 637745kB | 2869852320.00 | 2870605000.00 | 0.03% | 2869852320.00 | 2870635000.00 | 0.03% | 2869852320.00 | 2870616600.00 | 0.03% |
| 845002kB | 3802508928.00 | 3803520000.00 | 0.03% | 3802508928.00 | 3803536000.00 | 0.03% | 3802508928.00 | 3803525400.00 | 0.03% |
Benchmark performed with data sizes: 223231kB, 430488kB, 637745kB, 845002kB.
Each data size is tested 5 times, hence the first 5 entries on the x-axis correspond to the 5 runs for the first data size of 223231kB and so on.
The table contains the values after scaling the original values up using the scaling factor 1.00. The table entries for BENCH and LIKWID have the unit 'Micro Ops'
| Variant | BENCH (Min) | LIKWID (Min) | Error (Min) | BENCH (Max) | LIKWID (Max) | Error (Max) | BENCH (Avg) | LIKWID (Avg) | Error (Avg) |
|---|---|---|---|---|---|---|---|---|---|
| 223231kB | 3869335808.00 | 3870581000.00 | 0.03% | 3869335808.00 | 3870604000.00 | 0.03% | 3869335808.00 | 3870592600.00 | 0.03% |
| 430488kB | 3730896000.00 | 3732039000.00 | 0.03% | 3730896000.00 | 3732061000.00 | 0.03% | 3730896000.00 | 3732046000.00 | 0.03% |
| 637745kB | 2763561632.00 | 2764404000.00 | 0.03% | 2763561632.00 | 2764420000.00 | 0.03% | 2763561632.00 | 2764410000.00 | 0.03% |
| 845002kB | 3661675264.00 | 3662847000.00 | 0.03% | 3661675264.00 | 3662891000.00 | 0.03% | 3661675264.00 | 3662873000.00 | 0.03% |
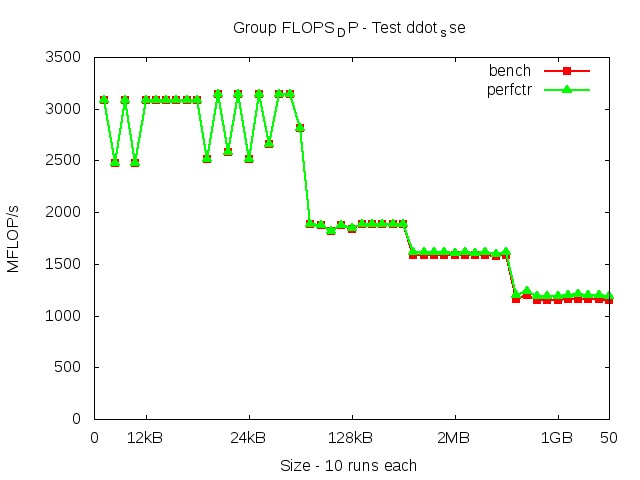
Benchmark performed with data sizes: 12kB, 24kB, 128kB, 2MB, 1GB.
Each data size is tested 10 times, hence the first 10 entries on the x-axis correspond to the 10 runs for the first data size of 12kB and so on.
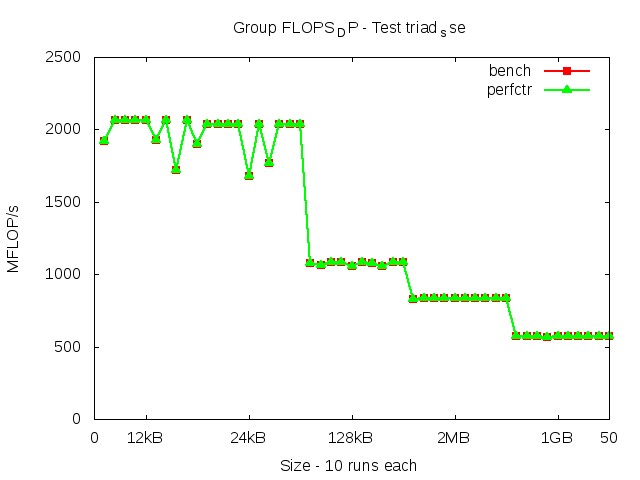
The table contains the values after scaling the original values up using the scaling factor 1.00. The table entries for BENCH and LIKWID have the unit 'MFLOP/s'
| Variant | BENCH (Min) | LIKWID (Min) | Error (Min) | BENCH (Max) | LIKWID (Max) | Error (Max) | BENCH (Avg) | LIKWID (Avg) | Error (Avg) |
|---|---|---|---|---|---|---|---|---|---|
| 12kB | 1917.00 | 1917.00 | 0.00% | 2067.00 | 2067.97 | 0.05% | 1986.60 | 1987.05 | 0.02% |
| 24kB | 2038.00 | 2038.02 | 0.00% | 2036.00 | 2036.84 | 0.04% | 1974.90 | 1975.28 | 0.02% |
| 128kB | 1083.00 | 1083.25 | 0.02% | 1082.00 | 1082.96 | 0.09% | 1074.80 | 1075.30 | 0.05% |
| 2MB | 835.00 | 835.18 | 0.02% | 834.00 | 835.00 | 0.12% | 834.20 | 834.78 | 0.07% |
| 1GB | 574.00 | 574.67 | 0.12% | 572.00 | 573.94 | 0.34% | 572.40 | 573.75 | 0.24% |
Benchmark performed with data sizes: 12kB, 24kB, 128kB, 2MB, 1GB.
Each data size is tested 10 times, hence the first 10 entries on the x-axis correspond to the 10 runs for the first data size of 12kB and so on.
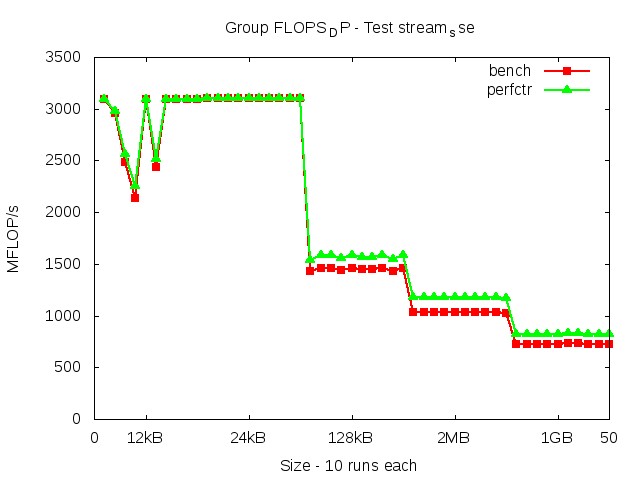
The table contains the values after scaling the original values up using the scaling factor 1.00. The table entries for BENCH and LIKWID have the unit 'MFLOP/s'
| Variant | BENCH (Min) | LIKWID (Min) | Error (Min) | BENCH (Max) | LIKWID (Max) | Error (Max) | BENCH (Avg) | LIKWID (Avg) | Error (Avg) |
|---|---|---|---|---|---|---|---|---|---|
| 12kB | 3091.00 | 3091.17 | 0.01% | 2138.00 | 2252.51 | 5.36% | 2856.60 | 2885.01 | 1.21% |
| 24kB | 3101.00 | 3101.15 | 0.00% | 3100.00 | 3100.98 | 0.03% | 3100.10 | 3100.69 | 0.02% |
| 128kB | 1427.00 | 1536.68 | 7.69% | 1461.00 | 1585.18 | 8.50% | 1450.10 | 1569.78 | 8.25% |
| 2MB | 1028.00 | 1168.90 | 13.71% | 1035.00 | 1181.19 | 14.13% | 1035.10 | 1179.73 | 13.97% |
| 1GB | 724.00 | 819.35 | 13.17% | 737.00 | 833.58 | 13.10% | 726.40 | 822.27 | 13.20% |
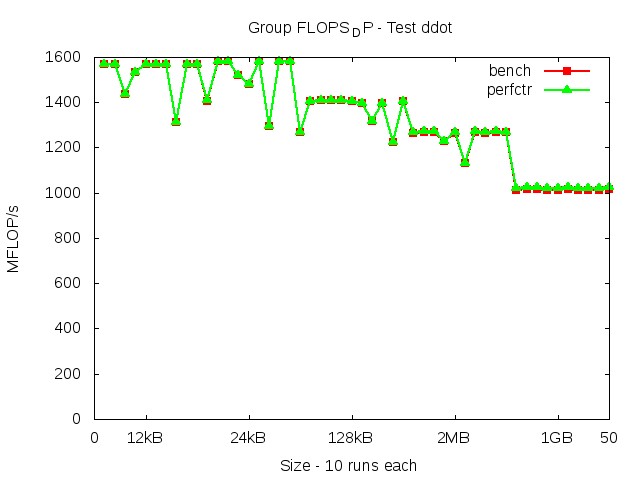
Benchmark performed with data sizes: 12kB, 24kB, 128kB, 2MB, 1GB.
Each data size is tested 10 times, hence the first 10 entries on the x-axis correspond to the 10 runs for the first data size of 12kB and so on.
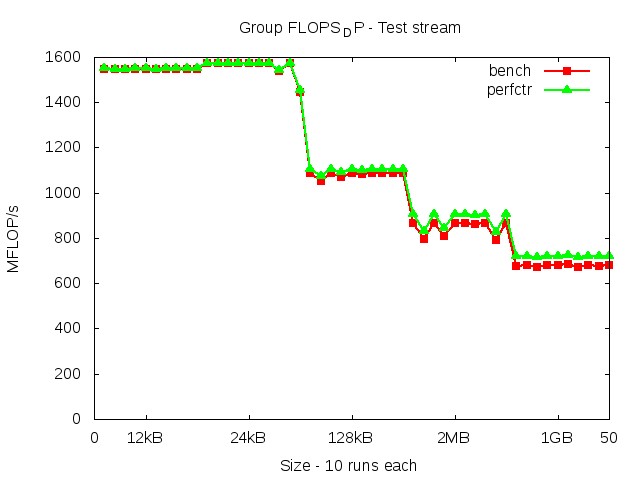
The table contains the values after scaling the original values up using the scaling factor 1.00. The table entries for BENCH and LIKWID have the unit 'MFLOP/s'
| Variant | BENCH (Min) | LIKWID (Min) | Error (Min) | BENCH (Max) | LIKWID (Max) | Error (Max) | BENCH (Avg) | LIKWID (Avg) | Error (Avg) |
|---|---|---|---|---|---|---|---|---|---|
| 12kB | 1549.00 | 1549.09 | 0.01% | 1549.00 | 1549.71 | 0.05% | 1548.90 | 1549.35 | 0.03% |
| 24kB | 1573.00 | 1573.36 | 0.02% | 1445.00 | 1453.92 | 0.62% | 1556.80 | 1558.40 | 0.11% |
| 128kB | 1088.00 | 1105.68 | 1.63% | 1052.00 | 1073.03 | 2.00% | 1081.60 | 1100.11 | 1.71% |
| 2MB | 793.00 | 827.18 | 4.31% | 863.00 | 903.23 | 4.66% | 845.70 | 883.74 | 4.50% |
| 1GB | 674.00 | 714.52 | 6.01% | 679.00 | 720.52 | 6.12% | 678.60 | 719.69 | 6.06% |
Benchmark performed with data sizes: 12kB, 24kB, 128kB, 2MB, 1GB.
Each data size is tested 10 times, hence the first 10 entries on the x-axis correspond to the 10 runs for the first data size of 12kB and so on.
The table contains the values after scaling the original values up using the scaling factor 1.00. The table entries for BENCH and LIKWID have the unit 'MFLOP/s'
| Variant | BENCH (Min) | LIKWID (Min) | Error (Min) | BENCH (Max) | LIKWID (Max) | Error (Max) | BENCH (Avg) | LIKWID (Avg) | Error (Avg) |
|---|---|---|---|---|---|---|---|---|---|
| 12kB | 3089.00 | 3089.01 | 0.00% | 3088.00 | 3088.95 | 0.03% | 2975.70 | 2976.31 | 0.02% |
| 24kB | 2554.00 | 2554.09 | 0.00% | 3142.00 | 3142.50 | 0.02% | 3011.00 | 3011.36 | 0.01% |
| 128kB | 1869.00 | 1869.56 | 0.03% | 1783.00 | 1786.16 | 0.18% | 1856.50 | 1857.69 | 0.06% |
| 2MB | 1470.00 | 1472.04 | 0.14% | 1507.00 | 1515.36 | 0.55% | 1486.40 | 1491.50 | 0.34% |
| 1GB | 1105.00 | 1122.07 | 1.54% | 1105.00 | 1122.62 | 1.59% | 1105.00 | 1122.42 | 1.58% |
Benchmark performed with data sizes: 12kB, 24kB, 128kB, 2MB, 1GB.
Each data size is tested 10 times, hence the first 10 entries on the x-axis correspond to the 10 runs for the first data size of 12kB and so on.
The table contains the values after scaling the original values up using the scaling factor 1.00. The table entries for BENCH and LIKWID have the unit 'MFLOP/s'
| Variant | BENCH (Min) | LIKWID (Min) | Error (Min) | BENCH (Max) | LIKWID (Max) | Error (Max) | BENCH (Avg) | LIKWID (Avg) | Error (Avg) |
|---|---|---|---|---|---|---|---|---|---|
| 12kB | 1358.00 | 1358.34 | 0.02% | 1571.00 | 1571.81 | 0.05% | 1485.70 | 1486.31 | 0.04% |
| 24kB | 1585.00 | 1585.01 | 0.00% | 1584.00 | 1584.99 | 0.06% | 1519.30 | 1519.82 | 0.03% |
| 128kB | 1032.00 | 1032.15 | 0.01% | 1049.00 | 1050.12 | 0.11% | 1033.60 | 1034.16 | 0.05% |
| 2MB | 980.00 | 980.02 | 0.00% | 1000.00 | 1001.20 | 0.12% | 981.40 | 982.03 | 0.06% |
| 1GB | 844.00 | 845.68 | 0.20% | 844.00 | 845.93 | 0.23% | 844.00 | 845.80 | 0.21% |
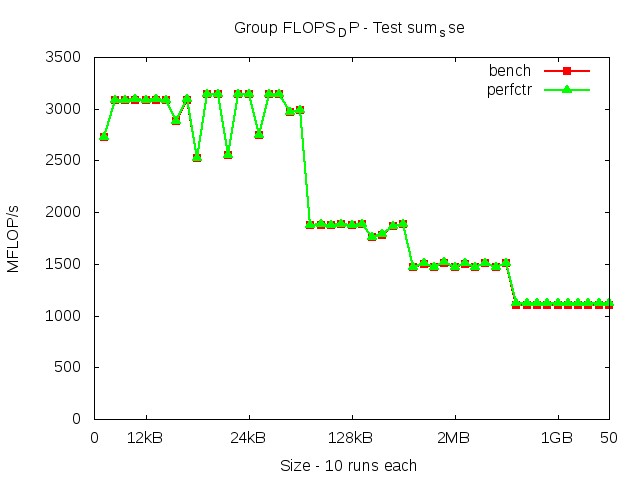
Benchmark performed with data sizes: 12kB, 24kB, 128kB, 2MB, 1GB.
Each data size is tested 10 times, hence the first 10 entries on the x-axis correspond to the 10 runs for the first data size of 12kB and so on.
The table contains the values after scaling the original values up using the scaling factor 1.00. The table entries for BENCH and LIKWID have the unit 'MFLOP/s'
| Variant | BENCH (Min) | LIKWID (Min) | Error (Min) | BENCH (Max) | LIKWID (Max) | Error (Max) | BENCH (Avg) | LIKWID (Avg) | Error (Avg) |
|---|---|---|---|---|---|---|---|---|---|
| 12kB | 2475.00 | 2475.05 | 0.00% | 3087.00 | 3087.97 | 0.03% | 2962.90 | 2963.51 | 0.02% |
| 24kB | 2810.00 | 2810.11 | 0.00% | 2513.00 | 2513.94 | 0.04% | 2877.50 | 2877.97 | 0.02% |
| 128kB | 1888.00 | 1888.15 | 0.01% | 1816.00 | 1821.40 | 0.30% | 1871.30 | 1872.88 | 0.09% |
| 2MB | 1573.00 | 1596.30 | 1.48% | 1584.00 | 1610.40 | 1.67% | 1583.50 | 1609.10 | 1.62% |
| 1GB | 1196.00 | 1235.66 | 3.32% | 1151.00 | 1191.80 | 3.54% | 1160.30 | 1200.62 | 3.48% |
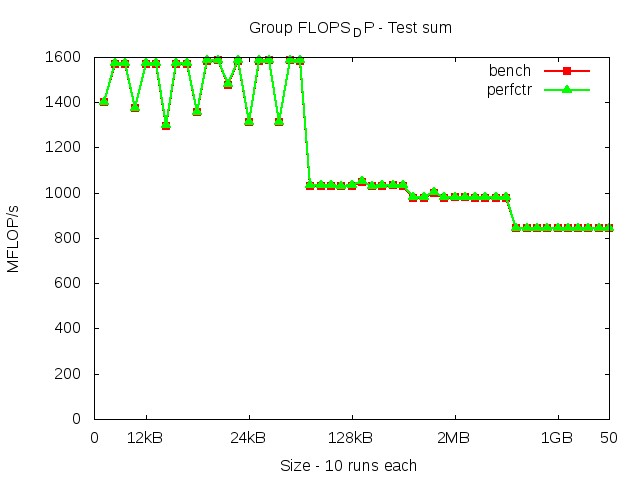
Benchmark performed with data sizes: 12kB, 24kB, 128kB, 2MB, 1GB.
Each data size is tested 10 times, hence the first 10 entries on the x-axis correspond to the 10 runs for the first data size of 12kB and so on.
The table contains the values after scaling the original values up using the scaling factor 1.00. The table entries for BENCH and LIKWID have the unit 'MFLOP/s'
| Variant | BENCH (Min) | LIKWID (Min) | Error (Min) | BENCH (Max) | LIKWID (Max) | Error (Max) | BENCH (Avg) | LIKWID (Avg) | Error (Avg) |
|---|---|---|---|---|---|---|---|---|---|
| 12kB | 1570.00 | 1570.08 | 0.00% | 1534.00 | 1534.86 | 0.06% | 1527.30 | 1527.67 | 0.02% |
| 24kB | 1521.00 | 1521.08 | 0.01% | 1293.00 | 1294.98 | 0.15% | 1489.10 | 1489.63 | 0.04% |
| 128kB | 1410.00 | 1410.13 | 0.01% | 1397.00 | 1398.00 | 0.07% | 1378.00 | 1378.66 | 0.05% |
| 2MB | 1132.00 | 1132.50 | 0.04% | 1269.00 | 1272.41 | 0.27% | 1249.80 | 1252.50 | 0.21% |
| 1GB | 1016.00 | 1023.52 | 0.74% | 1014.00 | 1022.36 | 0.82% | 1014.20 | 1021.99 | 0.77% |
Benchmark performed with data sizes: 12kB, 24kB, 128kB, 2MB, 1GB.
Each data size is tested 10 times, hence the first 10 entries on the x-axis correspond to the 10 runs for the first data size of 12kB and so on.
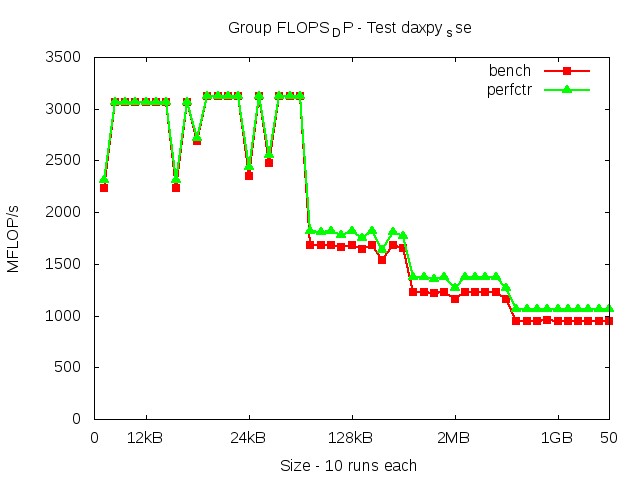
The table contains the values after scaling the original values up using the scaling factor 1.00. The table entries for BENCH and LIKWID have the unit 'MFLOP/s'
| Variant | BENCH (Min) | LIKWID (Min) | Error (Min) | BENCH (Max) | LIKWID (Max) | Error (Max) | BENCH (Avg) | LIKWID (Avg) | Error (Avg) |
|---|---|---|---|---|---|---|---|---|---|
| 12kB | 3069.00 | 3069.13 | 0.00% | 2234.00 | 2312.54 | 3.52% | 2863.10 | 2882.86 | 0.85% |
| 24kB | 3122.00 | 3124.32 | 0.07% | 2348.00 | 2433.86 | 3.66% | 2979.30 | 2997.28 | 0.73% |
| 128kB | 1536.00 | 1637.49 | 6.61% | 1686.00 | 1816.56 | 7.74% | 1660.70 | 1782.31 | 7.31% |
| 2MB | 1159.00 | 1263.81 | 9.04% | 1229.00 | 1369.74 | 11.45% | 1214.60 | 1347.18 | 10.89% |
| 1GB | 950.00 | 1063.60 | 11.96% | 947.00 | 1061.65 | 12.11% | 949.20 | 1063.35 | 12.03% |
Benchmark performed with data sizes: 12kB, 24kB, 128kB, 2MB, 1GB.
Each data size is tested 10 times, hence the first 10 entries on the x-axis correspond to the 10 runs for the first data size of 12kB and so on.
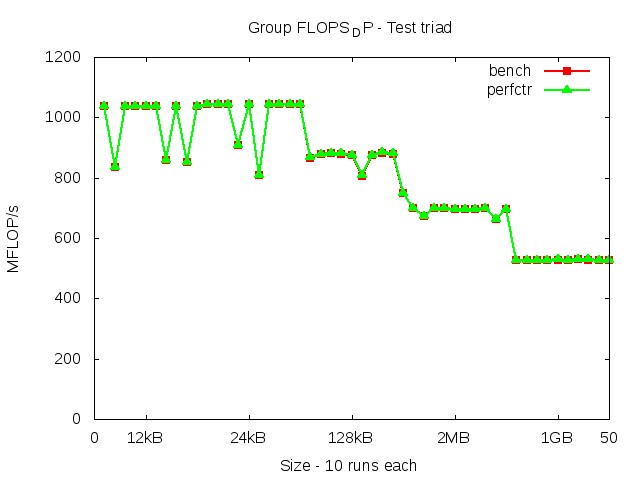
The table contains the values after scaling the original values up using the scaling factor 1.00. The table entries for BENCH and LIKWID have the unit 'MFLOP/s'
| Variant | BENCH (Min) | LIKWID (Min) | Error (Min) | BENCH (Max) | LIKWID (Max) | Error (Max) | BENCH (Avg) | LIKWID (Avg) | Error (Avg) |
|---|---|---|---|---|---|---|---|---|---|
| 12kB | 834.00 | 834.04 | 0.00% | 1037.00 | 1037.90 | 0.09% | 980.40 | 981.03 | 0.06% |
| 24kB | 809.00 | 809.12 | 0.01% | 1043.00 | 1043.87 | 0.08% | 1006.50 | 1006.95 | 0.04% |
| 128kB | 875.00 | 875.13 | 0.01% | 866.00 | 867.02 | 0.12% | 857.30 | 857.86 | 0.07% |
| 2MB | 672.00 | 672.00 | 0.00% | 699.00 | 699.86 | 0.12% | 691.40 | 691.83 | 0.06% |
| 1GB | 527.00 | 527.48 | 0.09% | 527.00 | 528.39 | 0.26% | 527.40 | 528.34 | 0.18% |
Benchmark performed with data sizes: 12kB, 24kB, 128kB, 2MB, 1GB.
Each data size is tested 10 times, hence the first 10 entries on the x-axis correspond to the 10 runs for the first data size of 12kB and so on.
The table contains the values after scaling the original values up using the scaling factor 1.00. The table entries for BENCH and LIKWID have the unit 'MFLOP/s'
| Variant | BENCH (Min) | LIKWID (Min) | Error (Min) | BENCH (Max) | LIKWID (Max) | Error (Max) | BENCH (Avg) | LIKWID (Avg) | Error (Avg) |
|---|---|---|---|---|---|---|---|---|---|
| 12kB | 1566.00 | 1566.03 | 0.00% | 1056.00 | 1057.19 | 0.11% | 1454.50 | 1455.06 | 0.04% |
| 24kB | 1582.00 | 1582.19 | 0.01% | 1445.00 | 1446.04 | 0.07% | 1414.10 | 1414.60 | 0.04% |
| 128kB | 1145.00 | 1145.28 | 0.02% | 1274.00 | 1275.07 | 0.08% | 1215.40 | 1216.04 | 0.05% |
| 2MB | 891.00 | 891.40 | 0.04% | 1034.00 | 1035.42 | 0.14% | 980.40 | 981.35 | 0.10% |
| 1GB | 868.00 | 869.74 | 0.20% | 870.00 | 872.43 | 0.28% | 873.00 | 875.11 | 0.24% |
Benchmark performed with data sizes: 12kB, 1MB, 4MB, 1GB.
Each data size is tested 5 times, hence the first 5 entries on the x-axis correspond to the 5 runs for the first data size of 12kB and so on.
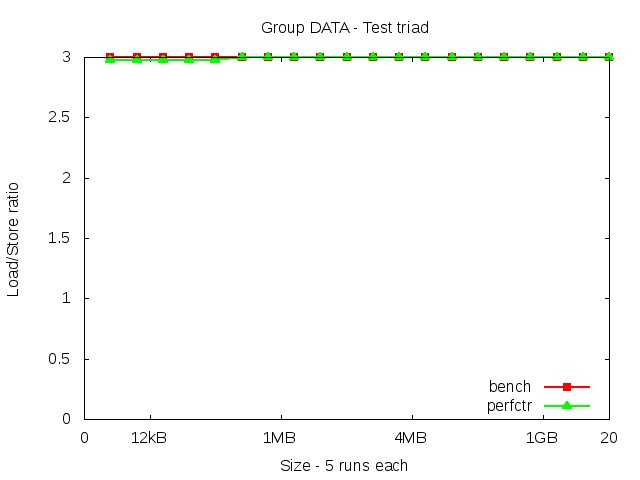
The table contains the values after scaling the original values up using the scaling factor 3.00. The table entries for BENCH and LIKWID have the unit 'Load/Store ratio'
| Variant | BENCH (Min) | LIKWID (Min) | Error (Min) | BENCH (Max) | LIKWID (Max) | Error (Max) | BENCH (Avg) | LIKWID (Avg) | Error (Avg) |
|---|---|---|---|---|---|---|---|---|---|
| 12kB | 3.00 | 2.98 | -0.70% | 3.00 | 2.98 | -0.70% | 3.00 | 2.98 | -0.70% |
| 1MB | 3.00 | 3.00 | -0.01% | 3.00 | 3.00 | -0.01% | 3.00 | 3.00 | -0.01% |
| 4MB | 3.00 | 3.00 | 0.00% | 3.00 | 3.00 | 0.00% | 3.00 | 3.00 | 0.00% |
| 1GB | 3.00 | 3.00 | 0.00% | 0.00 | 0.00 | 0.00% | 3.00 | 3.00 | 0.00% |
Benchmark performed with data sizes: 12kB, 1MB, 4MB, 1GB.
Each data size is tested 5 times, hence the first 5 entries on the x-axis correspond to the 5 runs for the first data size of 12kB and so on.
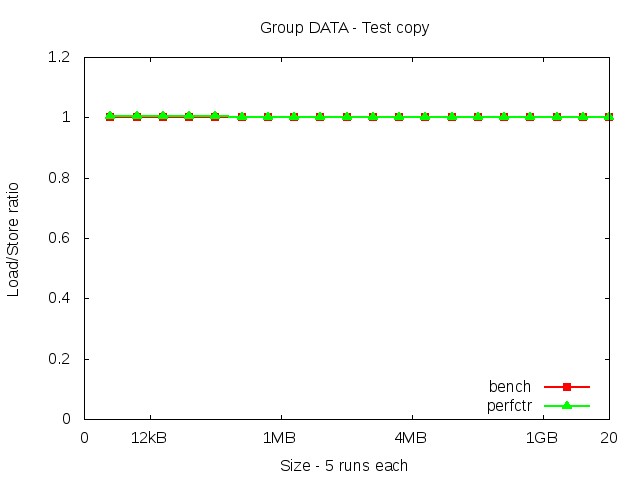
The table contains the values after scaling the original values up using the scaling factor 1.00. The table entries for BENCH and LIKWID have the unit 'Load/Store ratio'
| Variant | BENCH (Min) | LIKWID (Min) | Error (Min) | BENCH (Max) | LIKWID (Max) | Error (Max) | BENCH (Avg) | LIKWID (Avg) | Error (Avg) |
|---|---|---|---|---|---|---|---|---|---|
| 12kB | 1.00 | 1.01 | 0.53% | 1.00 | 1.01 | 0.53% | 1.00 | 1.01 | 0.53% |
| 1MB | 1.00 | 1.00 | 0.01% | 1.00 | 1.00 | 0.01% | 1.00 | 1.00 | 0.01% |
| 4MB | 1.00 | 1.00 | 0.00% | 0.00 | 0.00 | 0.00% | 1.00 | 1.00 | 0.00% |
| 1GB | 1.00 | 1.00 | 0.00% | 0.00 | 0.00 | 0.00% | 1.00 | 1.00 | 0.00% |
Benchmark performed with data sizes: 12kB, 1MB, 4MB, 1GB.
Each data size is tested 5 times, hence the first 5 entries on the x-axis correspond to the 5 runs for the first data size of 12kB and so on.
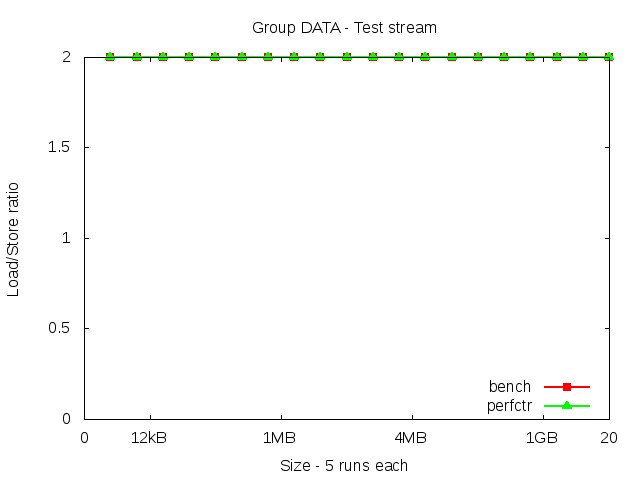
The table contains the values after scaling the original values up using the scaling factor 2.00. The table entries for BENCH and LIKWID have the unit 'Load/Store ratio'
| Variant | BENCH (Min) | LIKWID (Min) | Error (Min) | BENCH (Max) | LIKWID (Max) | Error (Max) | BENCH (Avg) | LIKWID (Avg) | Error (Avg) |
|---|---|---|---|---|---|---|---|---|---|
| 12kB | 2.00 | 2.00 | -0.10% | 2.00 | 2.00 | -0.10% | 2.00 | 2.00 | -0.10% |
| 1MB | 2.00 | 2.00 | 0.00% | 0.00 | 0.00 | 0.00% | 2.00 | 2.00 | 0.00% |
| 4MB | 2.00 | 2.00 | 0.00% | 0.00 | 0.00 | 0.00% | 2.00 | 2.00 | 0.00% |
| 1GB | 2.00 | 2.00 | 0.00% | 0.00 | 0.00 | 0.00% | 2.00 | 2.00 | 0.00% |
Benchmark performed with data sizes: 12kB, 1MB, 4MB, 1GB.
Each data size is tested 5 times, hence the first 5 entries on the x-axis correspond to the 5 runs for the first data size of 12kB and so on.
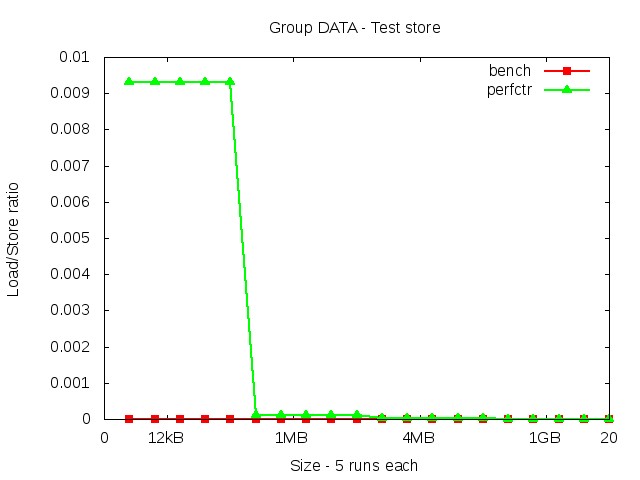
The table contains the values after scaling the original values up using the scaling factor 0.00. The table entries for BENCH and LIKWID have the unit 'Load/Store ratio'
| Variant | BENCH (Min) | LIKWID (Min) | Error (Min) | BENCH (Max) | LIKWID (Max) | Error (Max) | BENCH (Avg) | LIKWID (Avg) | Error (Avg) |
|---|---|---|---|---|---|---|---|---|---|
| 12kB | 0.00 | 0.00 | 0.00% | 0.00 | 0.00 | 0.00% | 0.00 | 0.01 | 0.00% |
| 1MB | 0.00 | 0.00 | 0.00% | 0.00 | 0.00 | 0.00% | 0.00 | 0.00 | 0.00% |
| 4MB | 0.00 | 0.00 | 0.00% | 0.00 | 0.00 | 0.00% | 0.00 | 0.00 | 0.00% |
| 1GB | 0.00 | 0.00 | 0.00% | 0.00 | 0.00 | 0.00% | 0.00 | 0.00 | 0.00% |