Using the CyDAQ User Interface
<< Previous Chapter | Home | Next Chapter >>
When running the app, you will be greeted with the main page, which is the mode selector. It's pretty simple, just select one of the modes. Only two of them are enabled at the moment.
There is a top menu bar where you can ping the CyDAQ and access the debug page. None of the other options work at the moment.

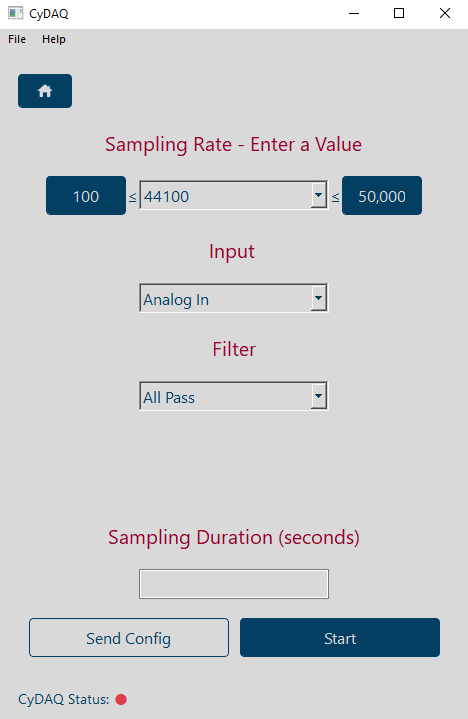
On this page, you can collect samples from the CyDAQ with any custom settings you want and save them to a file.
You can set the sample rate with the dropdown menu or typing in a value, and you can set the Input and Filters with the dropdowns.
For the Filters, the interface will morph depending on whichever other options you need. For 'All Pass,' there are no extra settings required, so that it will be empty. But for options like '1st Order High Pass' or '6th Order Band Pass,' the options will pop up on the screen.
You have the choice to either start/stop sampling as you choose, or you can set a specified time to sample in the "Sampling Time" field.
If you want to just send the configuration to the CyDAQ, you can with the "Send Config" button. This sends the config without sampling, and can allow for the CyDAQ to be used as a component in a circuit. Make sure that the CyDAQ is connected and the bottom label says "Connected!" before attempting.
The user interface will not let invalid options be used for any editable option.
When sampling, you can leave the 'Sampling Time' field blank and you will have control over how long you let the CyDAQ Collect Samples. Otherwise you can set a time limit for it to stop sampling if you need an exact measurement in the 'Sampling Time' box.
There is a label on this (and other) pages at the bottom that lets you know if the CyDAQ is connected or not, and will update about every second. You will not be able to sample if the CyDAQ is not connected.
To return to the home page, click the Home button at the top left of the page.
Note: This page has been disabled. The original idea was to have data be livestreamed from the cydaq and plotted directly as it was received, but we ran out of time. This current edition can input a CSV file and plot it live, which still has some functionality if you were to want to see what your sample output looked like. You have to re-enable it in the code in the
mode_selector.pyby uncommenting the live plotter code block.
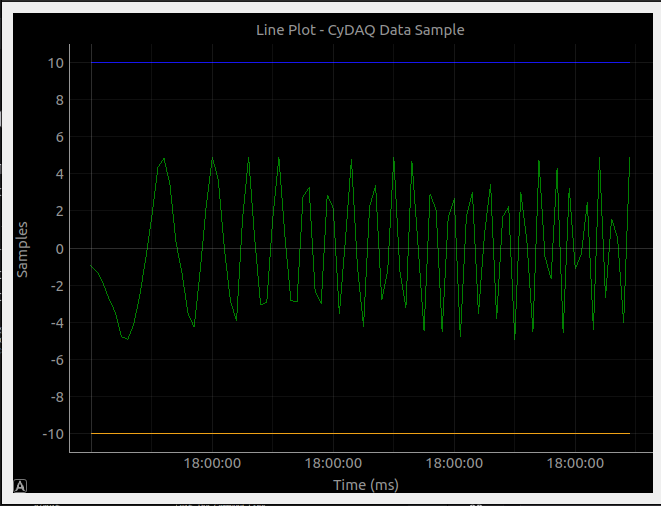
This page can be used to plot sample data on a graph. You can plot it instantly or have a delay to have a live plotting effect (this will be used in live streaming plotting data in a later feature).
First, you entire a file name by either clicking the button or typing in a file path. Then, you can choose between a scatter plot or a line plot. Next, you can choose the graphing speed delay by using the slider, setting it to 0 for zero delay (as fast as python can plot the data) or up to 100ms between plotting per delay. Then you can start the plotting with the "Start" button, and if you're "streaming" it, you can pause/unpause the graph with the pause button. At any time, you can clear the graph and plot another file.

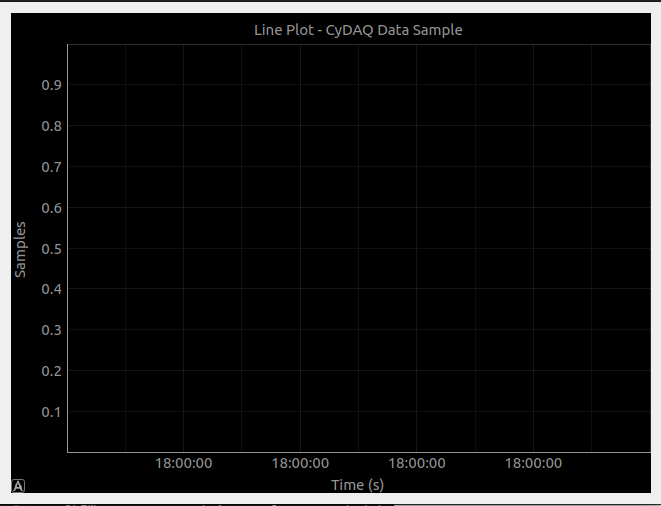
You can click the "Home" button in the top left to return to the mode selector page. This will remove the graph window, but it will save the graph that you currently have on it.
This page is the redesign of the old balance beam GUI that exists separate of the CyDAQ Mixer. This one aims to fix a few of the issues that the other one has, such as not being able to hotplug the CyDAQ, and having lots of issues where it needs to be reconnected and restarted to work, etc.
This version of the CyDAQ was implemented without any form of live connection to the CyDAQ, other than the wrapper. This was also a feature that we had originally planned to add, but had run out of time. Read below to see what some of the known issues/bugs are.
The Balance Beam Page looks like this:

As you can see, there is an indicator at the bottom of the page that shows if the CyDAQ is connected.
First, we have the button panel on the left side. None of the buttons will work unless the CyDAQ is connected. IF the CyDAQ is connected, then none of the buttons will work (with the exception of the start button) unless the balance beam is currently active.
The first buttons are the start/stop buttons. The Start button will attempt to start the balance beam mode by checking if the CyDAQ has the balance beam module connected to it. It will return false if this is the case. If t is connected and everything is in order, it should start the balance beam and plot data on the graph on the right side.
The balance beam has a few constants that are set for how the balance beam is supposed to operate. They are all set to 0 from the start, this will cause the balance beam to not work well at first. The user can set the values before they start the balance beam by entering the values and hitting "Start", or they can start the balance beam first and then enter the values using the "Send Constants" button.
The ball will be set on the balance beam at the set point. The default is 0, which is the center of the balance beam. You can set it to anything that is reachable on the balance beam, or else the balance beam will just send the ball to one side and not move. You can send the new set point by clicking "Send Set Point."
Save Plot Data is a feature that let's you save the plotting data into a matlab or csv file. There is currently a semi-working function for this, but the original idea was to have the GUI save the temp data in a file in the C:\Temp\ directory and then copy over the file whenever, because holding that data in memory can be a problem given enough time. Most of the code is implemented for this (the copyTempFile method), but we couldn't get it working at all.
Offset +/- buttons allow for the calibration of the ball on the balance beam, by moving the ball set a little bit up or down the beam depending on which button you click.
The Pause button does what you'd think it does, it pauses and resumes the balance beam without fully stopping it.
The plotting of the balance beam works by the GUI calling a method in the CLI wrapper that sends a command to the CLI tool and gets the ball's current position. It is run a lot, to simulate the data being "streamed." Again, this is because we weren't able to do a direct connection to the CyDAQ to get more accurate/efficient live data.
Note: As of writing this, the balance beam page was never fully finished. This was due to running out of time in the project because of fighting the implementation style that we chose. Therefore, there are some bugs that haven't had the chance to be fixed that we are aware of on the balance beam page.
-
When you start the balance beam, there was supposed to be a window that would pop up and let the user know that the program is checking the CyDAQ to see if the balance beam module is connected, but when it pops up (on the main thread or otherwise) it freezes the GUI and it won't start. But it does work as expected on the first attempt. We had to disable this in order for the balance beam module to work at all.
-
When the balance beam is running, if you were to stop the balance beam and restart it, the GUI would freeze and crash. This is likely an issue with the threading that I implemented (it honestly might not be that great, I am new to it) and not properly removing/killing the threads.
-
When the balance beam is running, if you were to press a button that sends a command to the CyDAQ (e.g. any button except for the
Save Databutton), the balance beam plotter increases in speed. This keeps going every time you press a button basically until the GUI crashes.- Possible Fix: This may have to do with the fact that I never put in a speed restriction in the while loop of the code, due to my initial tests showing that the code that I had now had decent speed metrics. If there were to be some kind of a
sleep()function call or something like that, that could fix it. - There also may be an issue with the data connectors used from pglive to plot the data. If there are 2 or more threads running that are plotting the data, it will just give the impression that it is running n times faster (n being the amount of threads running)
- Possible Fix: This may have to do with the fact that I never put in a speed restriction in the while loop of the code, due to my initial tests showing that the code that I had now had decent speed metrics. If there were to be some kind of a
-
The Balance Beam Page is just generally buggy as I didn't have the time to go through and debug due to not finishing everything. I don't have any cases for a few special edge cases that can occur when the balance beam has an error or is disconnected, etc.
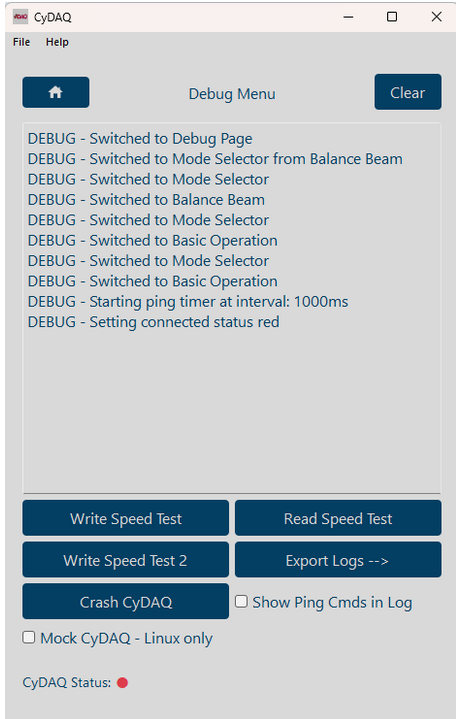
The debug page is a page that is used to get diagnostic information from the CyDAQ as well as a space for running whatever tests are included.
First, we have the Debug Log View. This is a text view that has all of the debug logs that are captured while running the GUI. As you can see in the screenshot below, it captures things at different levels, DEBUG, INFO, ERROR, and CRITICAL. It stores a lot file at C:\Temp\cydaq_current.log and appends to it live.
You can press the Clear button on the top right to clear the logs, and below there is an Export Logs --> button that can be used to export whatever is in the current logs. (The Clear button does not clear the log file, just the text view).
The "Test" buttons seen in the screenshot below are currently disabeld but were used to test the speed of python by reading and writing lots of data. The tests were to determine the capabilities of python for handling potential live data streaming in the future.
The Crash CyDAQ button was put there as well to test how the GUI would handle an exception being thrown and to cause the CyDAQ to crash. It currently works and is enabled but it doesn't really serve much of a purpose at the moment.
The Show Ping Cmds in Log checkbox allows for the ping commands to be logged. These are disabled by default because they fill up the logs fast (2 lines every one second, one for cmd sent and response received) and are only useful to diagnose connection issues.
The Mock CyDAQ - Linux Only checkbox enables the Mock Mode. This mode is available on Linux Only, and it mocks a serial port connection that can have commands be sent to (see gui/serial_comm.py for how this system works).