Examples:


![]()
Visualizes your BenchmarkDotNet benchmarks to Colorful images and Feature-rich HTML (and maybe powerful charts in the future!)
Dark Theme:
Light Theme:
A Comprehensive Performance Comparison Benchmark Between Different .NET Collections.
https://github.com/mjebrahimi/DotNet-Collections-Benchmark/
PM> Install-Package BenchmarkDotNetVisualizerMethods:
- SaveAsImageAsync()
- SaveAsHtmlAsync()
- SaveAsHtmlAndImageAsync()
Example:
var summary = BenchmarkAutoRunner.Run<JsonSerializersBenchmark>(); //Prefer to use BenchmarkAutoRunner instead of BenchmarkRunner

//[ProjectDirectory]\Reports\Benchmark-Dark.html
var htmlPath = DirectoryHelper.GetPathRelativeToProjectDirectory(@"Reports\Benchmark-Dark.html");

//[ProjectDirectory]\Reports\Benchmark-Dark.png
var imgPath = DirectoryHelper.GetPathRelativeToProjectDirectory(@"Reports\Benchmark-Dark.png");

var options = new ReportHtmlOptions
{
    Title = "Json Serializers Benchmark",
    GroupByColumns = ["Method"],                          // Groups by 'Method' column and highlights groups
    SpectrumColumns = ["Mean", "Allocated"],              // Colorizes 'Mean' and 'Allocated' columns as Spectrum
    DividerMode = RenderTableDividerMode.EmptyDividerRow, // Separates tables by Empty Divider Row
    HtmlWrapMode = HtmlDocumentWrapMode.Simple,           // Uses simple HTML table
    Theme = Theme.Dark                                    // Optional (Default is Dark)
};

await summary.SaveAsHtmlAndImageAsync(htmlPath, imgPath, options);
Note: Use BenchmarkAutoRunner to Run your benchmarks
Prefer to use BenchmarkAutoRunner.Run() instead of BenchmarkRunner.Run() to run your benchmarks.
BenchmarkAutoRunner is similar to BenchmarkRunner, but is Smarter!
BenchmarkAutoRunner.Run<JsonSerializersBenchmark>();
// Instead of
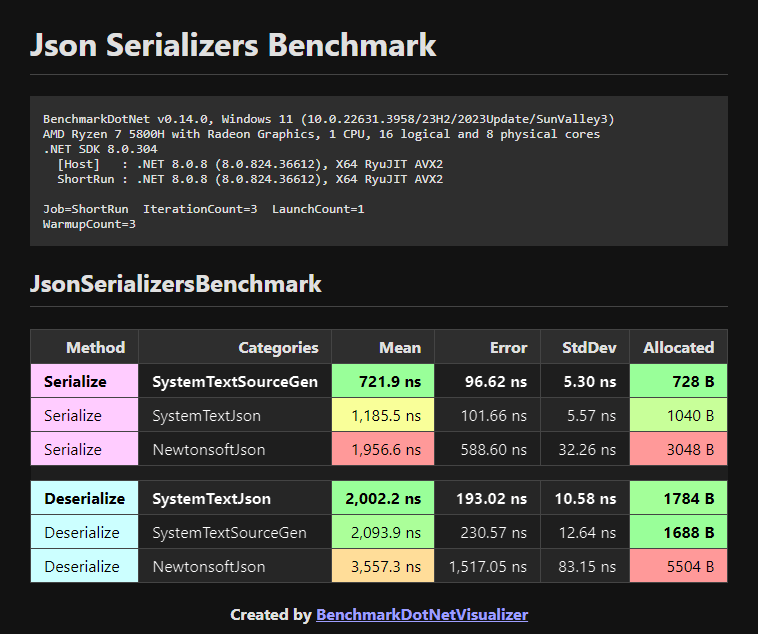
//BenchmarkRunner.Run<JsonSerializersBenchmark>();Output HTML:
Visit this HTML page at samples/JsonSerializersBenchmark/Reports/Benchmark-Dark.html
Output Image:
Note: prefer to use previous (recommended) methods.
Exporters:
- [RichImageExporter]
- [RichHtmlExporter]
Example:
BenchmarkAutoRunner.Run<JsonSerializersBenchmark>(); //Prefer to use BenchmarkAutoRunner instead of BenchmarkRunner
//Export to colorful image
[RichImageExporter(
title: "Json Serializers Benchmark",
groupByColumns: ["Method"], // Groups by 'Method' column and highlights groups
spectrumColumns: ["Mean", "Allocated"], // Colorizes 'Mean' and 'Allocated' columns as Spectrum and Sorts the result by them
//format: ImageFormat.Webp or Jpeg // You can set image format (Default is ImageFormat.Png)
//theme: Theme.Dark // Optional (Default is Dark)
)]
//Export to feature-rich HTML
[RichHtmlExporter(
title: "Json Serializers Benchmark",
groupByColumns: ["Method"], // Groups by 'Method' column and highlights groups
spectrumColumns: ["Mean", "Allocated"] // Colorizes 'Mean' and 'Allocated' columns as Spectrum and Sorts the result by them
//sortByColumns: ["Mean", "Allocated"] // You can also sort by other columns as you wish
//theme: Theme.Dark // Optional (Default is Dark)
)]
[MemoryDiagnoser(displayGenColumns: false)] // Displays Allocated column (without GC per Generation columns (Gen 0, Gen 1, Gen 2) due to false option)
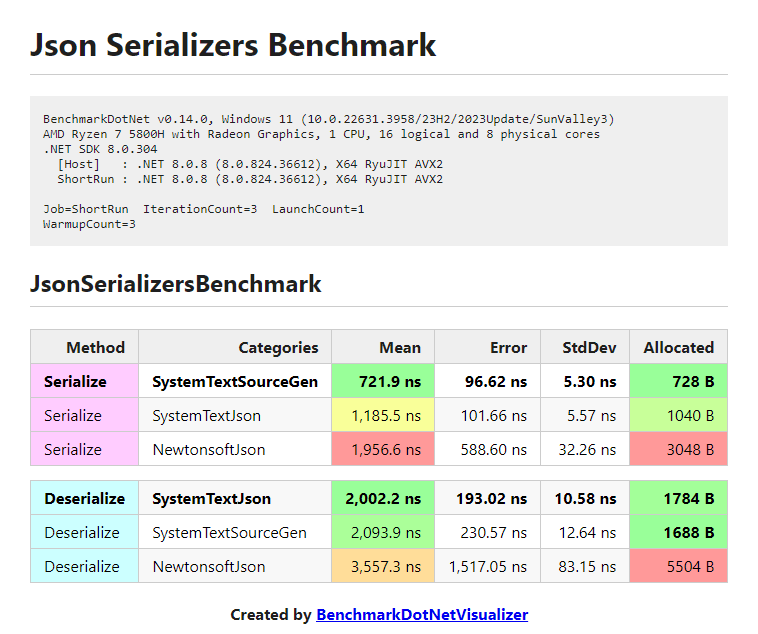
public class JsonSerializersBenchmark { ... }Output:
To see the results, navigate to the following path:
[ProjectDirectory]\bin\[Debug|Release]\[.NET-version]\BenchmarkDotNet.Artifacts\results\Benchmark-report-rich.html|png
For Example:
MyBenchmark\bin\Release\net8.0\BenchmarkDotNet.Artifacts\results\Benchmark-report-rich.pngMyBenchmark\bin\Release\net8.0\BenchmarkDotNet.Artifacts\results\Benchmark-report-rich.html
Example:
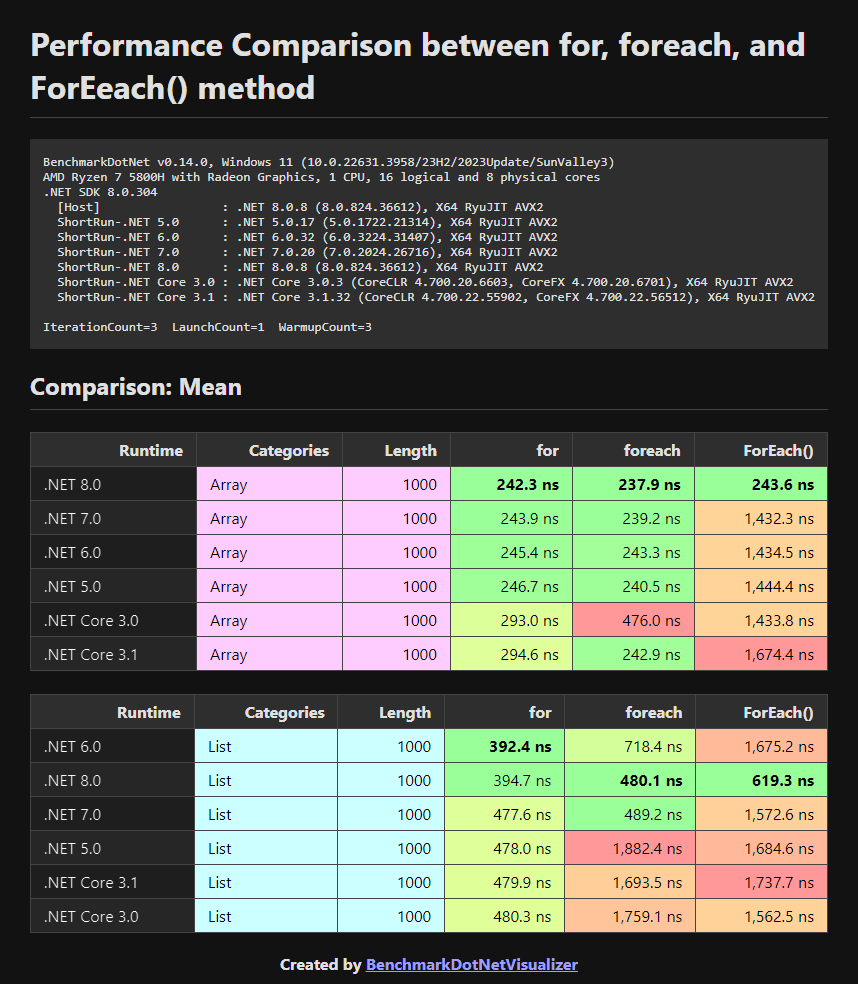
Performance benchmark between for, foreach, and ForEach() in different versions of .NET
var summary = BenchmarkAutoRunner.Run<IterationBenchmark>(); //Prefer to use BenchmarkAutoRunner instead of BenchmarkRunner

//[ProjectDirectory]\Reports\JoinedBenchmark-PivotBy-Method-Dark.html
var htmlPath = DirectoryHelper.GetPathRelativeToProjectDirectory(@"Reports\JoinedBenchmark-PivotBy-Method-Dark.html");

//[ProjectDirectory]\Reports\JoinedBenchmark-PivotBy-Method-Dark.png
var imagePath = DirectoryHelper.GetPathRelativeToProjectDirectory(@"Reports\JoinedBenchmark-PivotBy-Method-Dark.png");

var options = new JoinReportHtmlOptions
{
    Title = "Performance Comparison between for, foreach, and ForEach() method",
    MainColumn = "Runtime",
    GroupByColumns = ["Categories", "Length"],           // Groups by column 'Categories' and 'Length'
    PivotColumn = "Method",                              // Pivot 'Method' column per value of 'Mean'
    StatisticColumns = ["Mean"],                         // Colorizes 'Mean' columns as Spectrum
    ColumnsOrder = ["for", "foreach", "ForEach()"],      // Order of columns
    DividerMode = RenderTableDividerMode.SeparateTables, // Separates tables by Grouping by 'GroupByColumns'
    HtmlWrapMode = HtmlDocumentWrapMode.RichDataTables,  // Uses feature-rich https://datatables.net plugin
    Theme = Theme.Dark                                   // Optional (Default is Dark)
};

await summary.JoinReportsAndSaveAsHtmlAndImageAsync(htmlPath, imagePath, options);
Output HTML:
Visit this HTML page at samples/IterationBenchmark/Reports/JoinedBenchmark-PivotBy-Method-Dark.html
Output Image:
var summary = BenchmarkAutoRunner.Run<IterationBenchmark>(); //Prefer to use BenchmarkAutoRunner instead of BenchmarkRunner
//[ProjectDirectory]\Reports\JoinedBenchmark-PivotBy-Runtime-Dark.html
var htmlPath = DirectoryHelper.GetPathRelativeToProjectDirectory(@"Reports\JoinedBenchmark-PivotBy-Runtime-Dark.html");
//[ProjectDirectory]\Reports\JoinedBenchmark-PivotBy-Runtime-Dark.png
var imagePath = DirectoryHelper.GetPathRelativeToProjectDirectory(@"Reports\JoinedBenchmark-PivotBy-Runtime-Dark.png");
var options = new JoinReportHtmlOptions
{
Title = "Performance Comparison between for, foreach, and ForEach() method",
MainColumn = "Method",
GroupByColumns = ["Categories", "Length"], // Groups by column 'Categories' and 'Length'
PivotColumn = "Runtime", // Pivot 'Runtime' column per value of 'Mean'
StatisticColumns = ["Mean"], // Colorizes 'Mean' columns as Spectrum
ColumnsOrder = [".NET Core 3.0", ".NET Core 3.1", ".NET 5.0", ".NET 6.0", ".NET 7.0", ".NET 8.0"], //Order of columns
DividerMode = RenderTableDividerMode.SeparateTables, // Separates tables by Grouping by 'GroupByColumns'
HtmlWrapMode = HtmlDocumentWrapMode.RichDataTables, // Uses feature-rich https://datatables.net plugin
Theme = Theme.Dark // Optional (Default is Dark)
};
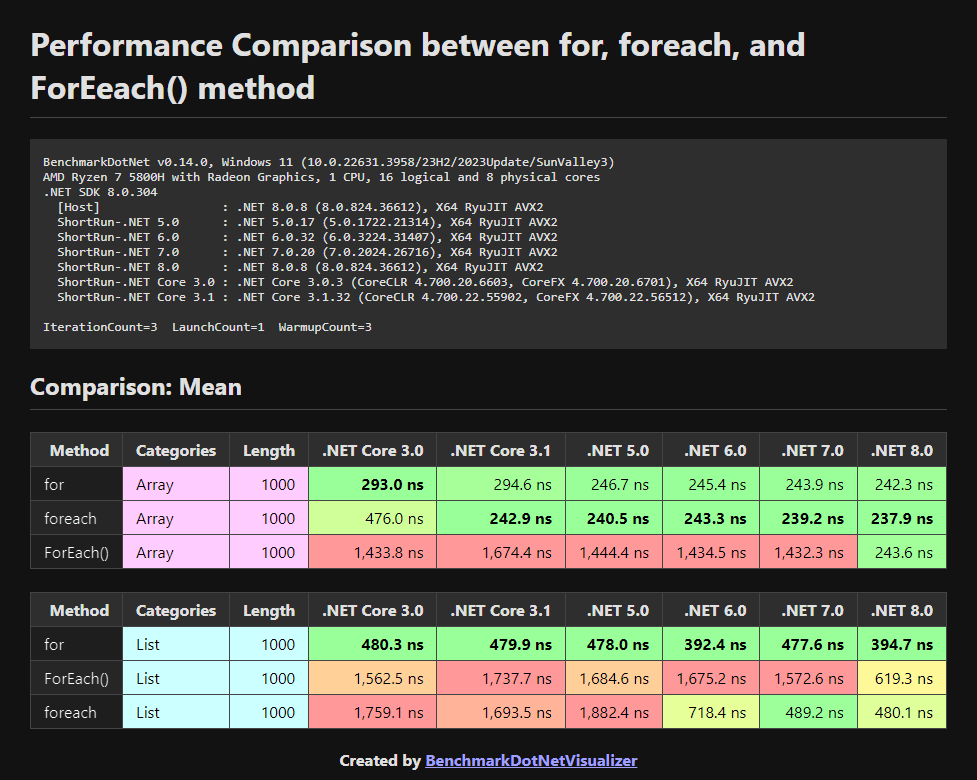
await summary.JoinReportsAndSaveAsHtmlAndImageAsync(htmlPath, imagePath, options);Output HTML:
Visit this HTML page at samples/IterationBenchmark/Reports/JoinedBenchmark-PivotBy-Runtime-Dark.html
Output Image:
- Chart Visualization
Create an issue if you find a BUG or have a Suggestion or Question.
If you want to develop this project :
- Fork it!
- Create your feature branch:
git checkout -b my-new-feature - Commit your changes:
git commit -am 'Add some feature' - Push to the branch:
git push origin my-new-feature - Submit a pull request
If you find this repository useful and like it, why not give it a star? if not, never mind! :)
Copyright © 2024 Mohammad Javad Ebrahimi under the MIT License.