Skip to content
New issue

Have a question about this project? Sign up for a free GitHub account to open an issue and contact its maintainers and the community.

By clicking “Sign up for GitHub”, you agree to our terms of service and privacy statement. We’ll occasionally send you account related emails.

Already on GitHub? Sign in to your account

Interpreting training results and showing loss stats/graph #1468

Closed
ghost opened this issue Nov 21, 2020 · 7 comments
Closed

Interpreting training results and showing loss stats/graph #1468

ghost opened this issue Nov 21, 2020 · 7 comments
Labels
question Further information is requested Stale

Comments

@ghost
Copy link

ghost commented Nov 21, 2020

I'm new to yolov5 and I'm trying to build a single class object detector(detecting mouth in an image).
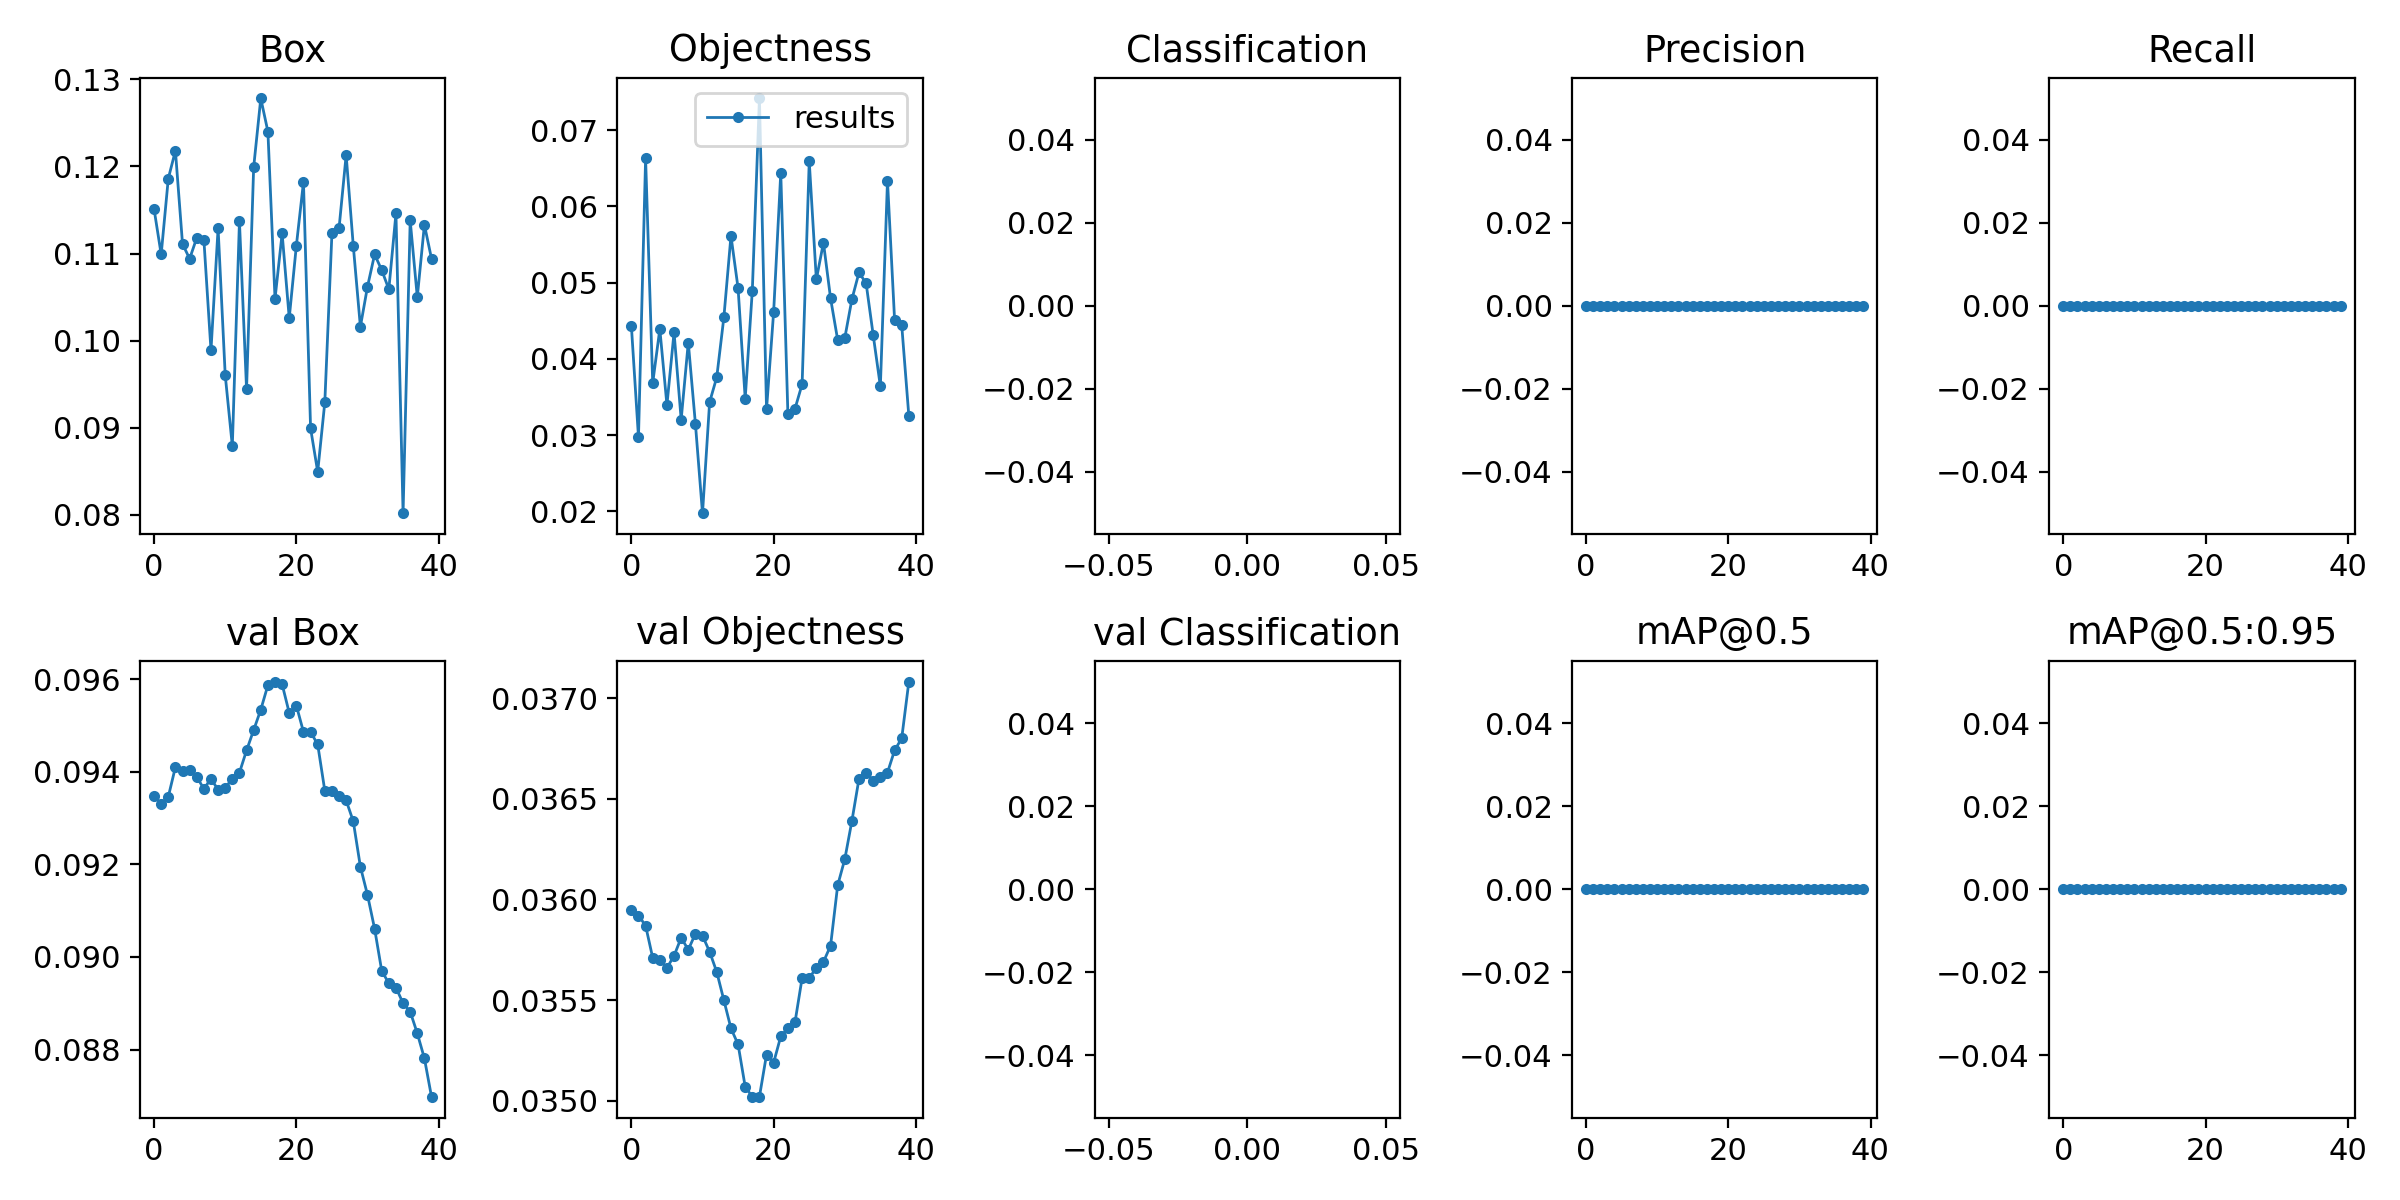
Here are the results I got:
results
I'm pretty sure that my dataset is problematic and thus the training wasn't successful, but putting this aside, I have two questions:

  1. how do I interpret the results and graphs above? I used Keras before and the results were pretty easy to understand, as they included accuracy(which is irrelevant here as I understand) and loss metrics for each epoch.
  2. I viewed several other projects in which the output includes GloU(example) - why don't I have this graph in my results and what does "GloU" mean?

PS - I have also tried running train.py on a dataset that includes a single image of my mouth labeled - the same image is used for training, validation, and testing. I expected the model to be able to learn to label this image correctly as it is the only data it gets, but when it comes to testing or validation - the model isn't able to detect anything above 0.05 confident rate after 200 epochs - and even then it draws random boxes and doesn't detect the mouth correctly. Is it the expected result, or does it indicates that something is wrong in my setup?

@ghost ghost added the question Further information is requested label Nov 21, 2020
@github-actions
Copy link
Contributor

github-actions bot commented Nov 21, 2020

Hello @naveedri, thank you for your interest in 🚀 YOLOv5! Please visit our ⭐️ Tutorials to get started, where you can find quickstart guides for simple tasks like Custom Data Training all the way to advanced concepts like Hyperparameter Evolution.

If this is a 🐛 Bug Report, please provide screenshots and minimum viable code to reproduce your issue, otherwise we can not help you.

If this is a custom training ❓ Question, please provide as much information as possible, including dataset images, training logs, screenshots, and a public link to online W&B logging if available.

For business inquiries or professional support requests please visit https://www.ultralytics.com or email Glenn Jocher at glenn.jocher@ultralytics.com.

Requirements

Python 3.8 or later with all requirements.txt dependencies installed, including torch>=1.7. To install run:

$ pip install -r requirements.txt

Environments

YOLOv5 may be run in any of the following up-to-date verified environments (with all dependencies including CUDA/CUDNN, Python and PyTorch preinstalled):

Status

CI CPU testing

If this badge is green, all YOLOv5 GitHub Actions Continuous Integration (CI) tests are currently passing. CI tests verify correct operation of YOLOv5 training (train.py), testing (test.py), inference (detect.py) and export (export.py) on MacOS, Windows, and Ubuntu every 24 hours and on every commit.

@glenn-jocher
Copy link
Member

glenn-jocher commented Nov 21, 2020

GIoU term is deprecated: #1120

Follow custom training tutorial:
https://docs.ultralytics.com/yolov5/tutorials/train_custom_data

@ghost
Copy link
Author

ghost commented Nov 21, 2020

GIoU term is deprecated: #1120

Follow custom training tutorial:
https://docs.ultralytics.com/yolov5/tutorials/train_custom_data

I have already followed the custom training tutorial, but I still don't know what each graph in the results.png says. Is there a loss graph? How should I measure the results?
I read about precision, recall(I think that these graphs are irrelevant as I have only one class), and mAP- but I still don't understand what do mAP@0.5, box, and objectness mean.

@glenn-jocher
Copy link
Member

@naveedri oh, for the metrics I would recommend the original YOLOv3 paper to brush up on the basics:
https://arxiv.org/abs/1804.02767

and wikipedia for metrics:
https://en.wikipedia.org/wiki/Precision_and_recall

@ghost
Copy link
Author

ghost commented Nov 22, 2020

@naveedri oh, for the metrics I would recommend the original YOLOv3 paper to brush up on the basics:
https://arxiv.org/abs/1804.02767

and wikipedia for metrics:
https://en.wikipedia.org/wiki/Precision_and_recall

Thank you so much!
Can you also refer to this part?

PS - I have also tried running train.py on a dataset that includes a single image of my mouth labeled - the same image is used for training, validation, and testing. I expected the model to be able to learn to label this image correctly as it is the only data it gets, but when it comes to testing or validation - the model isn't able to detect anything above 0.05 confident rate after 200 epochs - and even then it draws random boxes and doesn't detect the mouth correctly. Is it the expected result, or does it indicates that something is wrong in my setup?

Here are the results I got on this (again, single image, 200 epochs
results

@glenn-jocher
Copy link
Member

I'm pretty sure that my dataset is problematic and thus the training wasn't successful

You require a valid dataset for valid results.

@github-actions
Copy link
Contributor

This issue has been automatically marked as stale because it has not had recent activity. It will be closed if no further activity occurs. Thank you for your contributions.

Sign up for free to join this conversation on GitHub. Already have an account? Sign in to comment
Labels
question Further information is requested Stale
Projects
None yet
Development

No branches or pull requests

1 participant