The Dataset Grafana data source plugin allows you to create and visualize graphs and dashboards in Grafana using data in Dataset. You may want to use this plugin to allow you to visualize Dataset data next to other data sources, for instance when you want to monitor many feeds on a single dashboard.
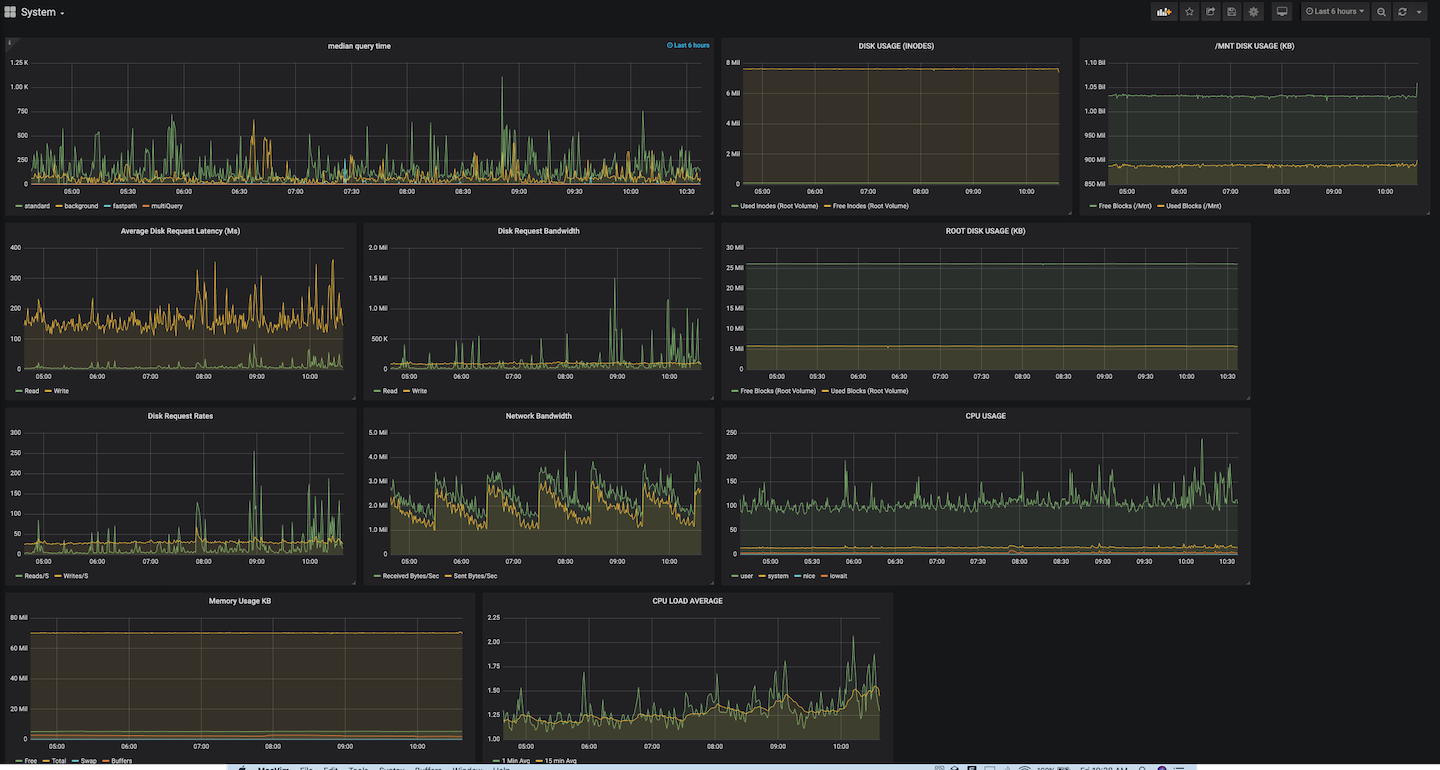
With the Dataset plugin, you will be able to create and visualize your log-based metrics along side all of your other data sources. It's a great way to have a single pane of glass for today's complex systems. You can leverage Grafana alerts based on Dataset data to notify you when there are possible issues. More importantly, you'll soon be able to jump to Dataset's fast, easy and intuitive platform to quickly identify the underlying causes of issues that may arise.
- An installed Grafana server instance with write access: This document assumes that an existing instance of Grafana already exists. If you need help bringing up a Grafana instance, please refer to the documentation provided by Grafana.
- A Dataset read log API Key: A Dataset API key is required for Grafana to pull data from Dataset. You can obtain one by going to your account in the Dataset product and selecting the “API Keys” from the menu in the top right corner. See the API Keys documentation for more.
Using grafana-cli: grafana-cli plugins install sentinelone-dataset-datasource
Alternatively, download the plugin and unzip it in the Grafana plugins directory (eg /var/lib/grafana/plugins). A restart of the Grafana server is required
afterwards.
-
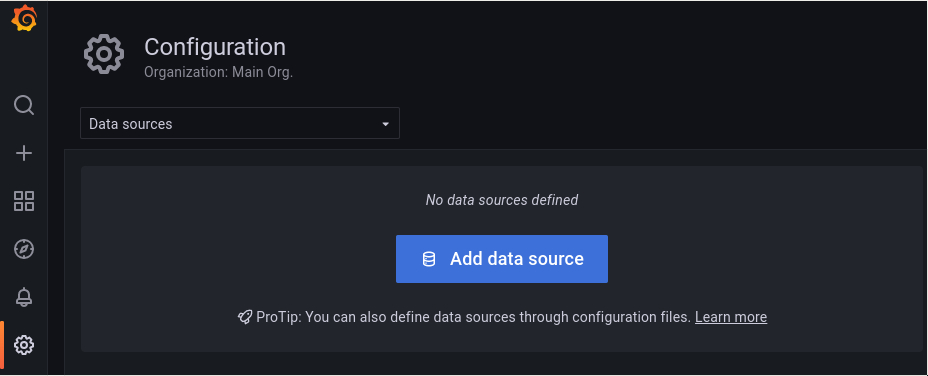
Log in to your grafana instance and navigate to Configuration Settings -> Data sources.

-
This will take you into the configuration page. If you already have other data sources installed, you will see them show up here. Click on the Add data source button:
-
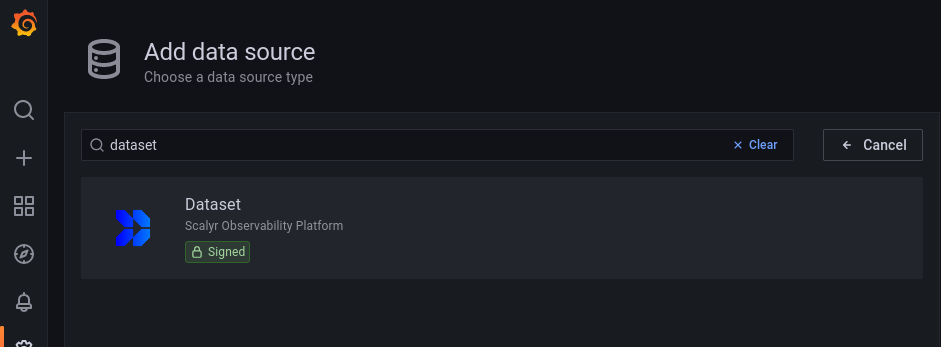
If you enter "Dataset" in the search bar on the resulting page you should see "Dataset" grafana plugin show up as an option.
-
Click on Select. This will take you to a configuration page where you insert your API key mentioned in the prerequisite section.
-
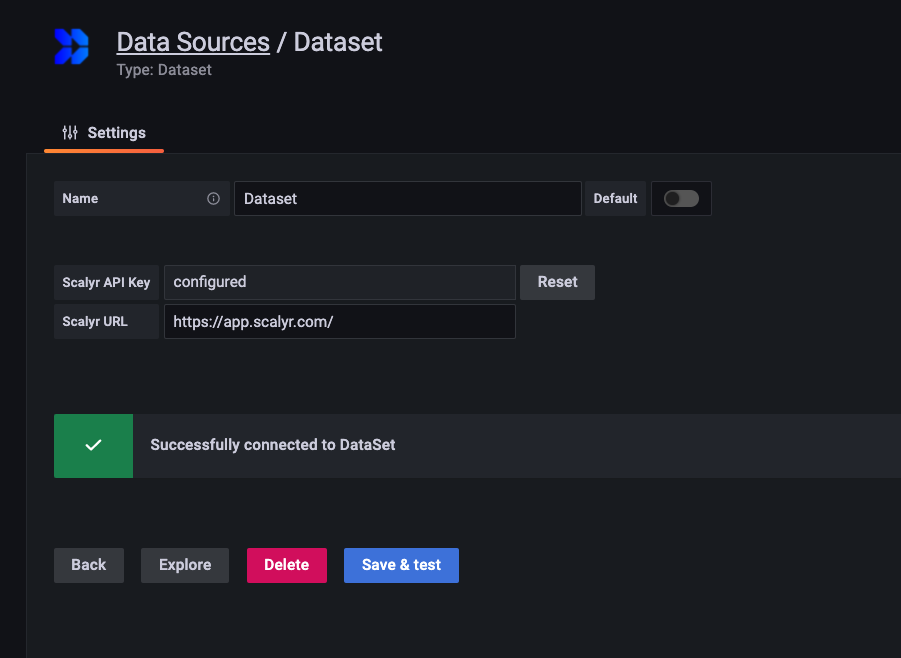
Enter these settings:
Field Name Value Dataset API Key Your Scalyr Read Logs API Key Dataset URL https://app.scalyr.comorhttps://app.eu.scalyr.comfor EU users. -
Click Save & Test to verify these settings are correct.
Now that you’ve completed installing and configuring the Dataset data source plugin, lets go through an example of how you can start using it to create a dashboard using Scalyr data.
-
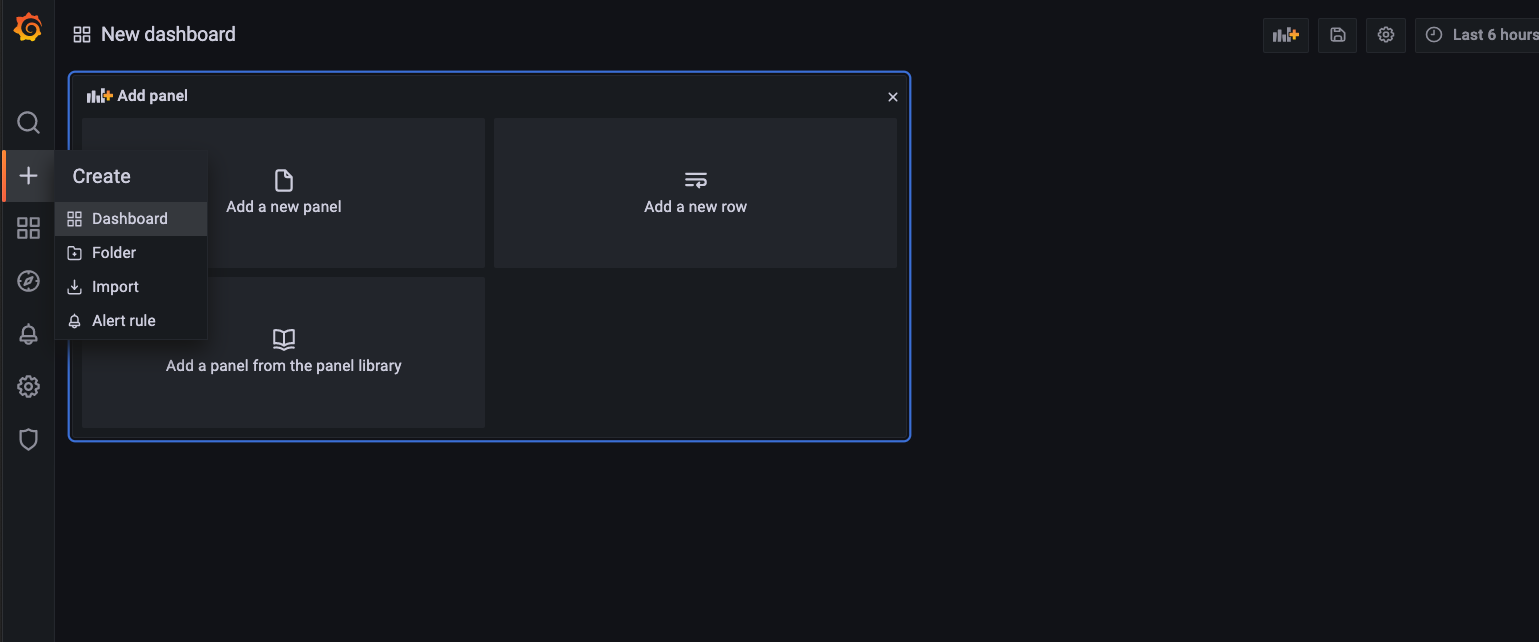
Create a new dashboard by click Create -> Dashboard.
-
In the New dashboard box, select the Add a new panel icon.
-
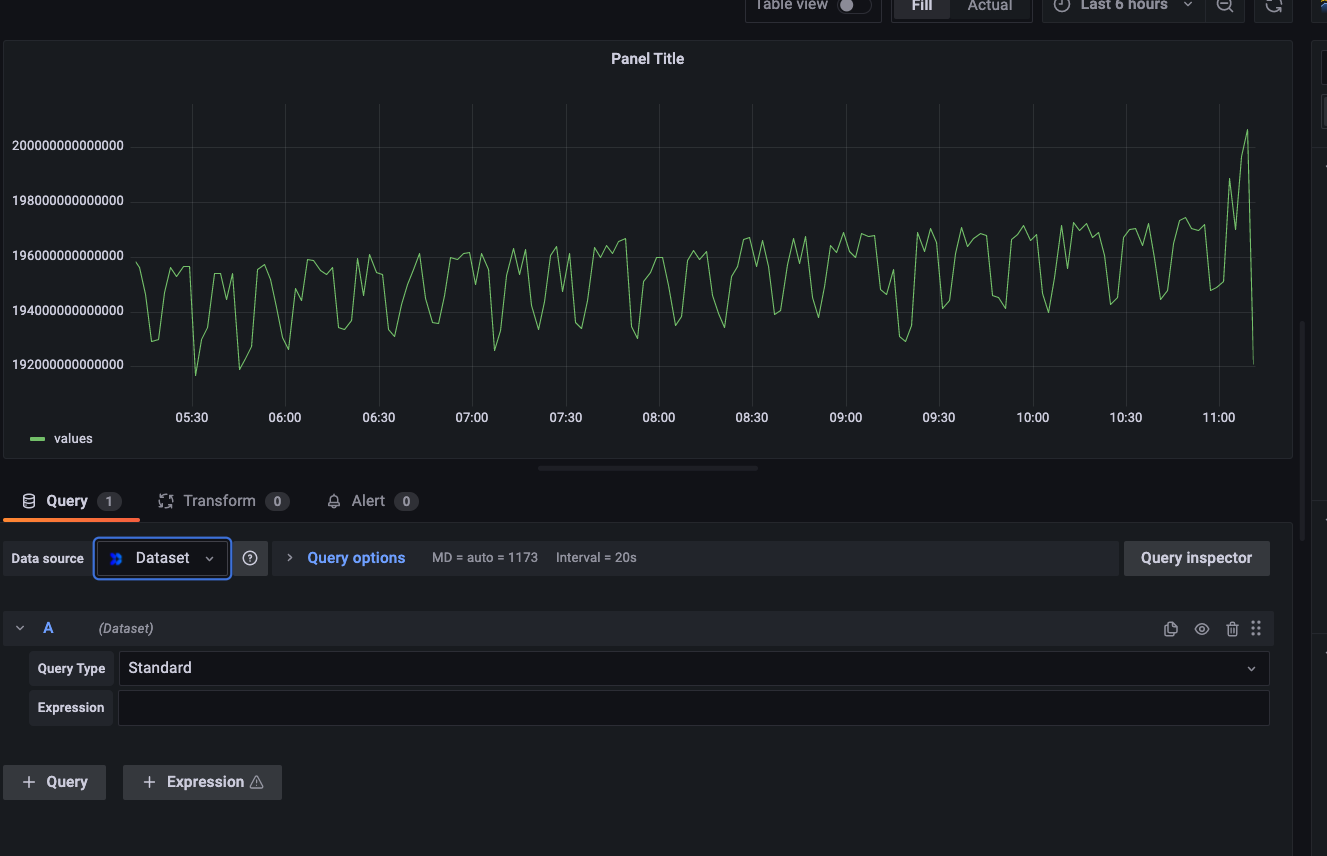
From the Data source dropdown, select Dataset.
-
A Query Type field allows to choose the type of query you wanted to search for.
-
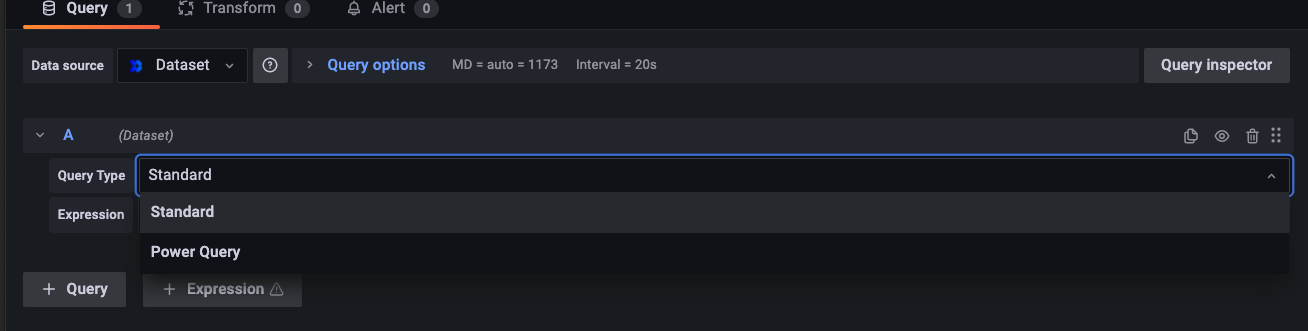
Standard Query - A standard query allows to search on Graph view. You can enter graph functions into the expression box and visualize the results. You can even enter and visualize complex expressions. See the Dashboards documentation for a list of supported functions.
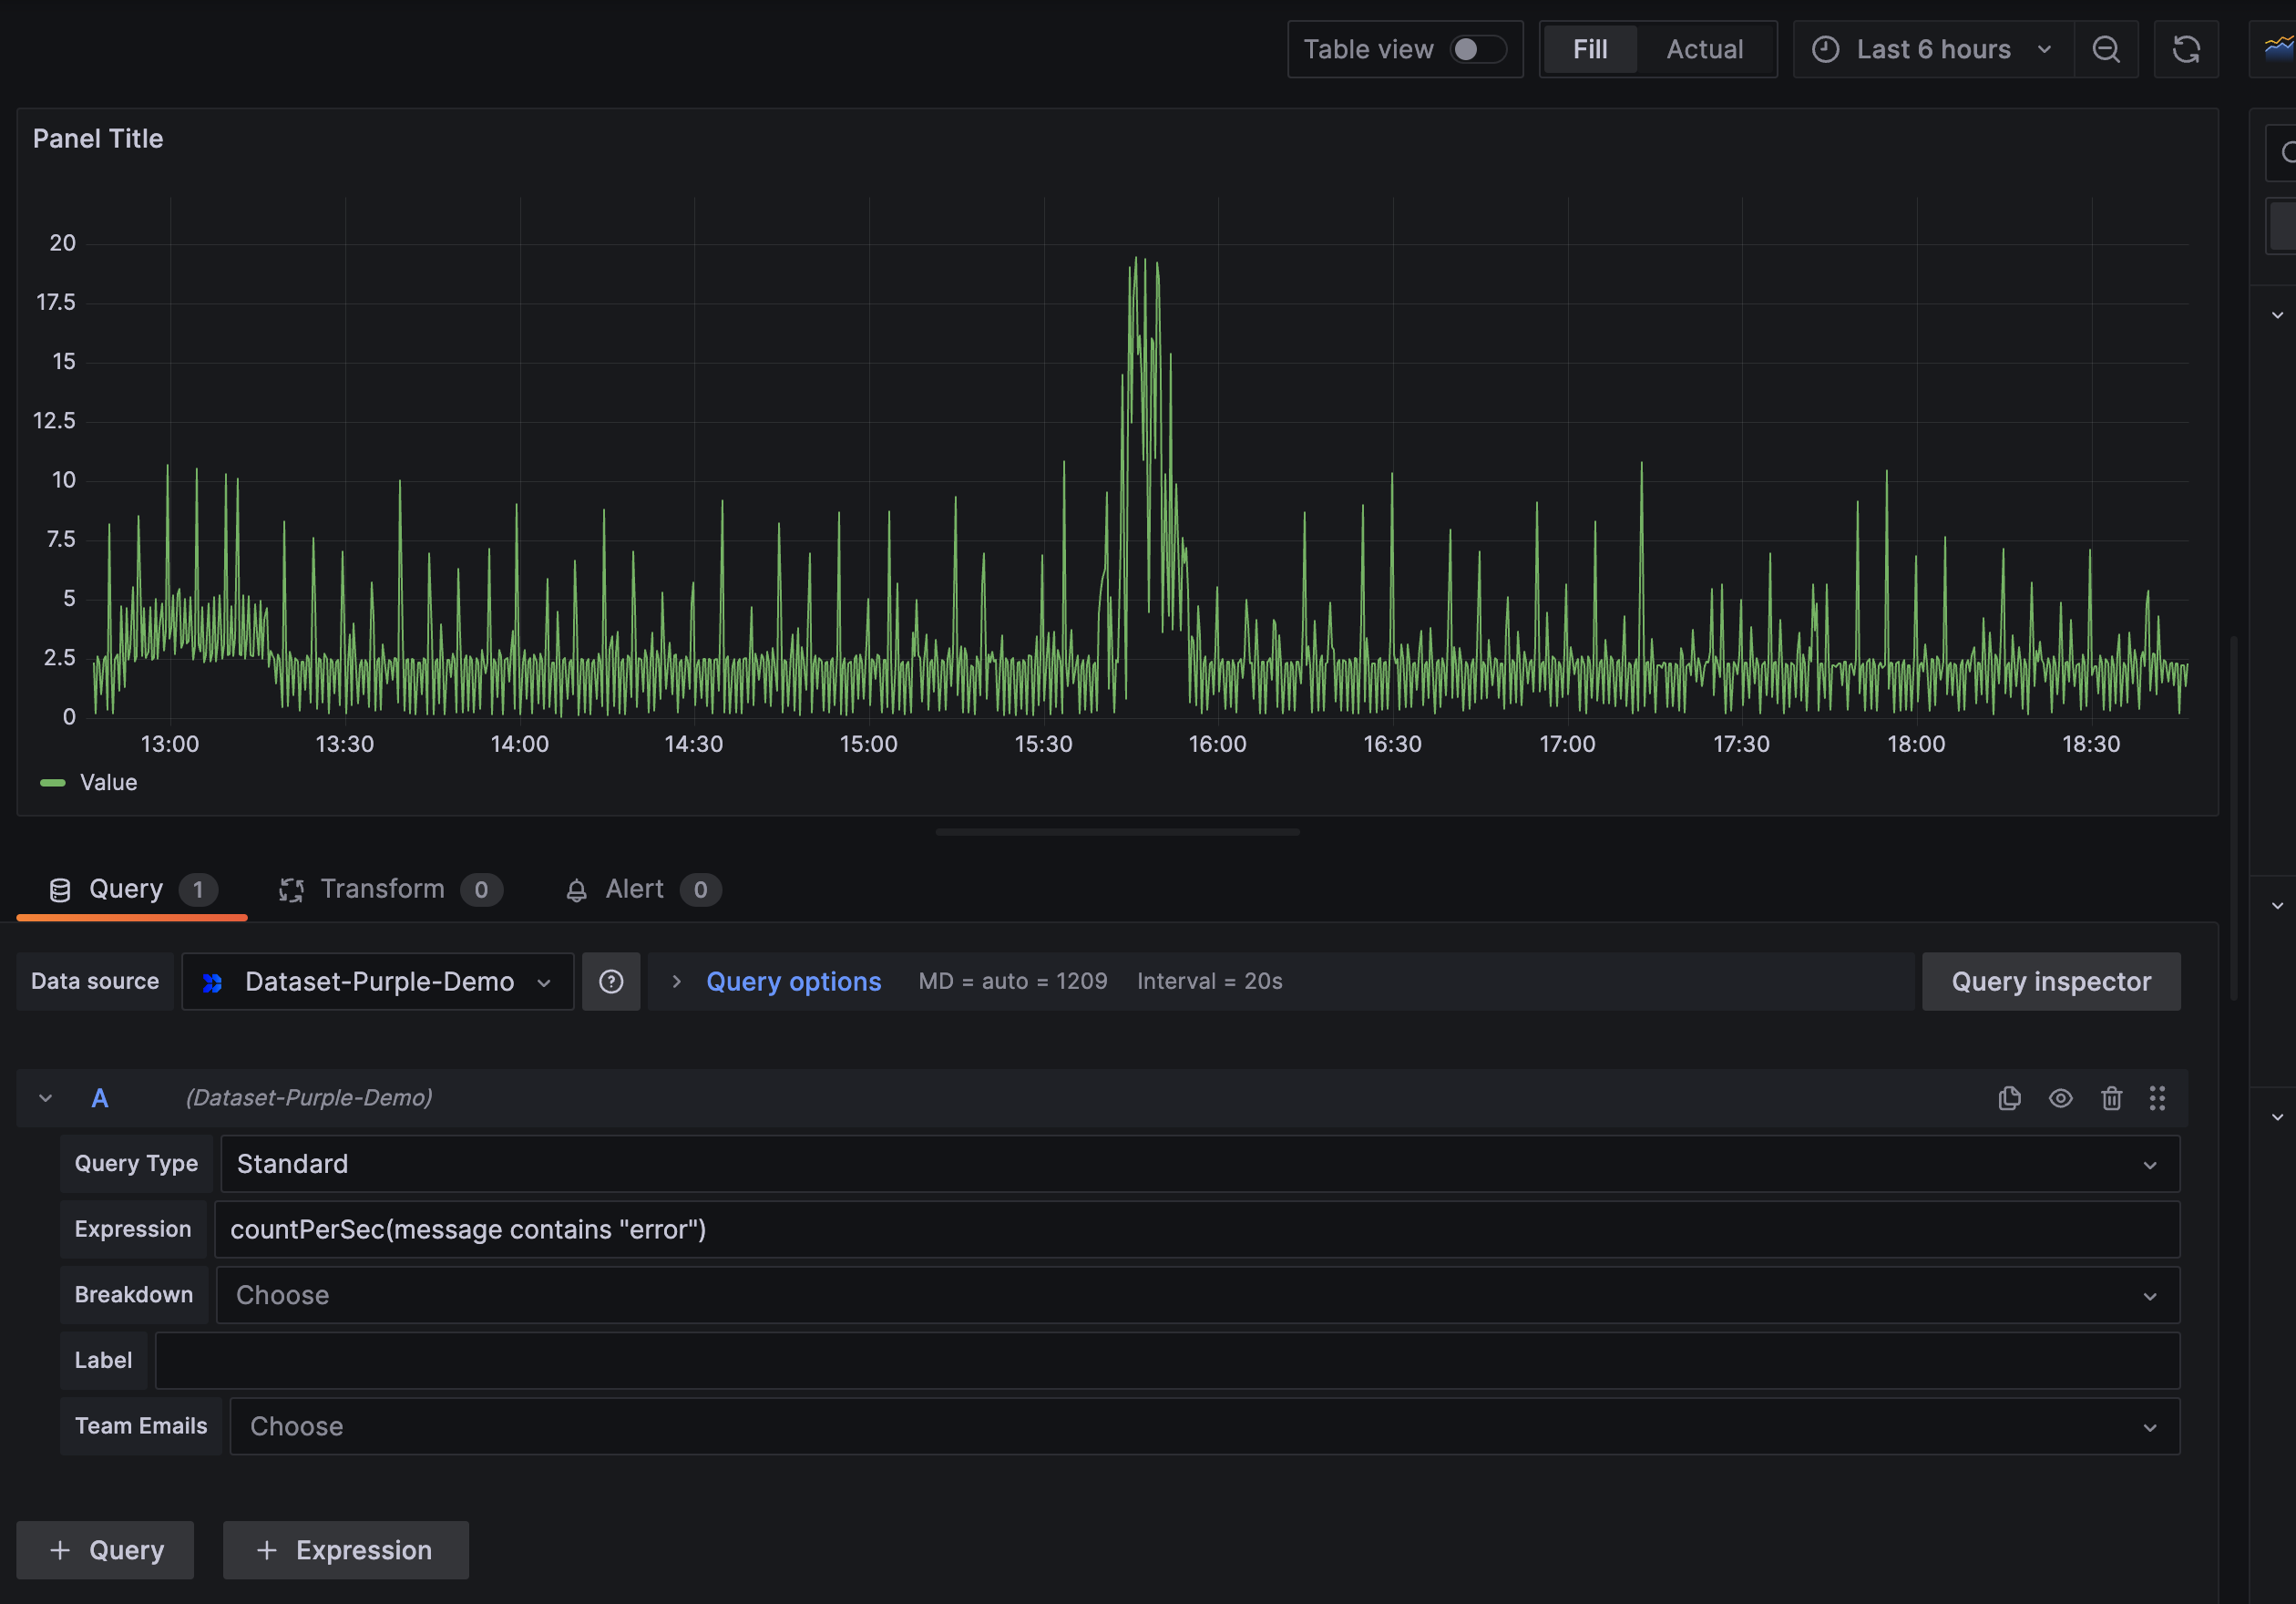
Enter an expression and click the save button. In the image below, we've added a query to graph the number of log messages that contain the word "error".
-
Power Query - Works similar to PQ search in Dataset app. You can enter rich set of commands for transforming and manipulating data. Data can be viewed in table format. See the PowerQueries documentation for more.
Note PowerQuery results are unsorted by default. If using a PowerQuery to populate a timeseries graph, make sure to sort results by appending
| sort -timestampto the query.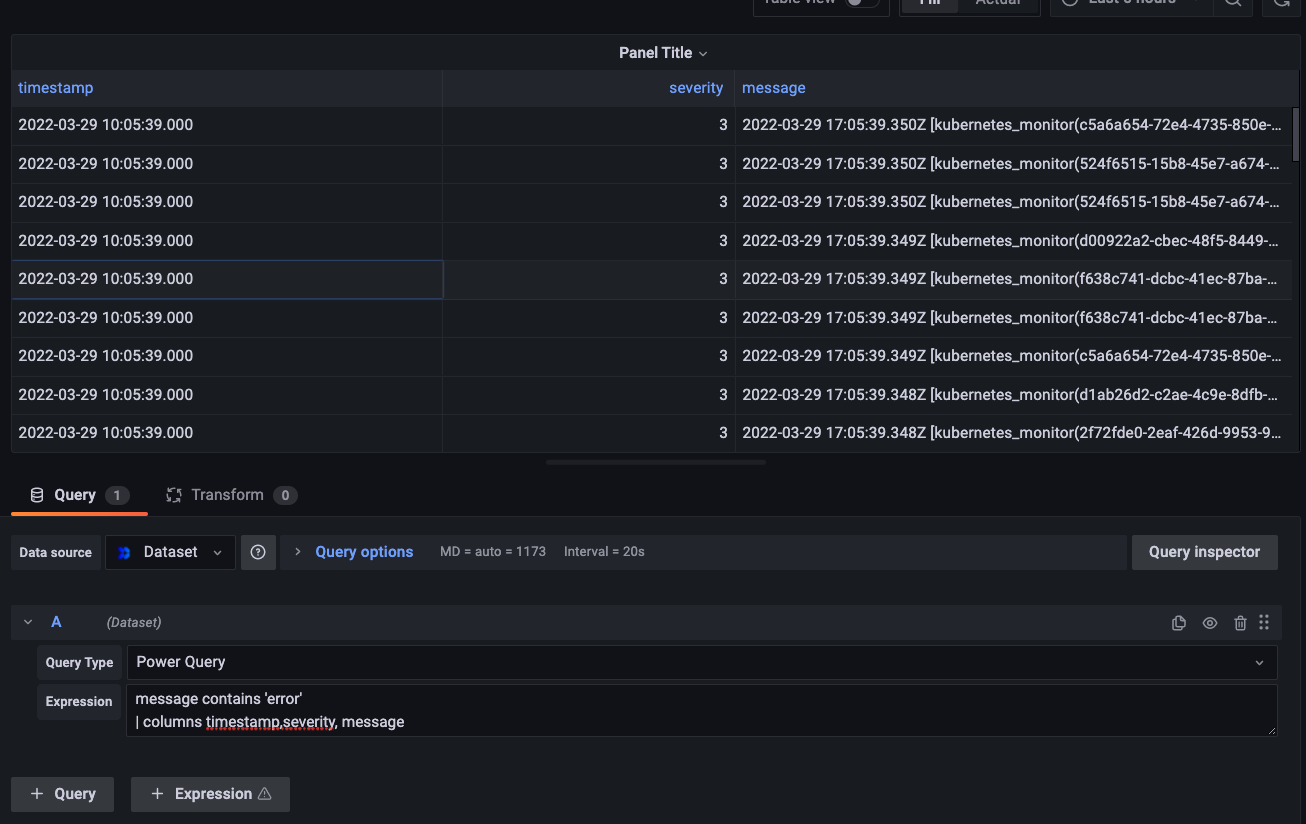
-
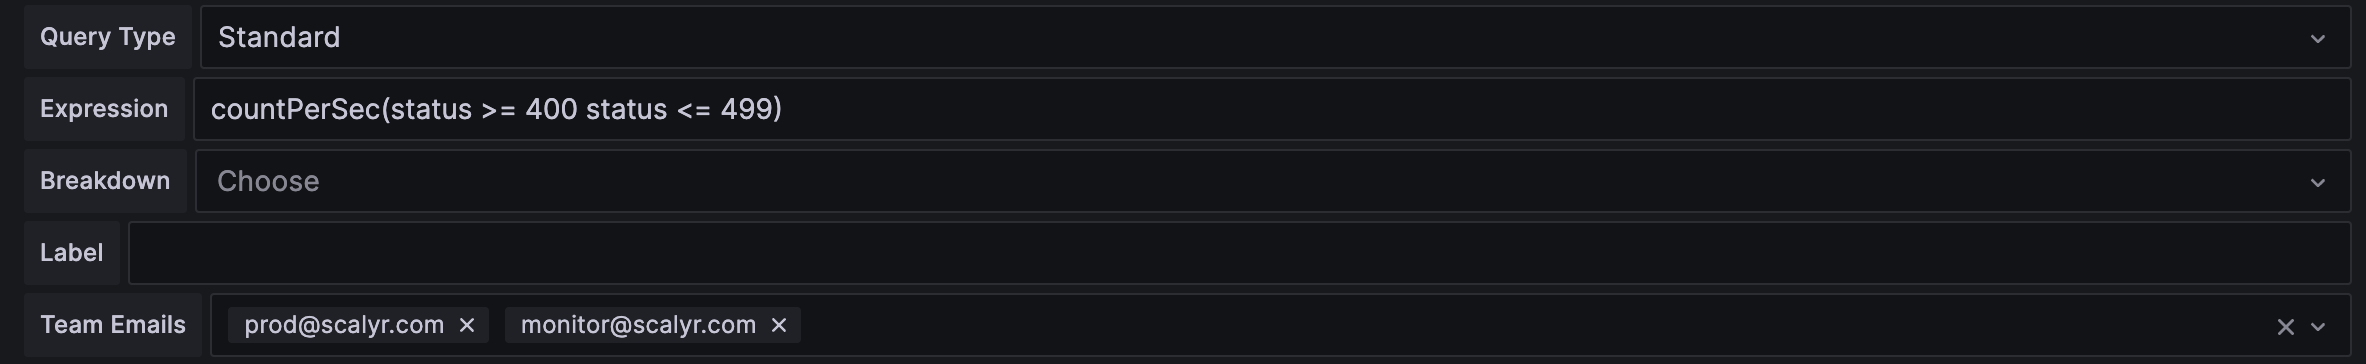
Cross Team Search - The Team Emails field is used to specify which teams the query should be run against. Works the same as Cross Team Search in the DataSet app. See the Teams documentation for more on teams. Note that the owner of the Log Read API key used to setup the DataSet Datasource must be a member of all teams being queried.
You’ve successfully installed, configured and created a graph in Grafana using Dataset data!
Note: you can add multiple queries to a visualization to plot multiple series on the same graph.
For general information on Grafana variables see the documentation on variable syntax and variable format options
Queries support all Grafana variable substitution syntaxes, for example:
$varname
${varname}
${varname:<format>}
For multi-value variables use the singlequote or doublequote formatting option:
${varname:singlequote} => 'value1','value2','value3'
${varname:doublequote} => "value1","value2","value3"
The expected use of multi-value variables is for in queries, for example:
$serverHost in (${host:singlequote})