Memory Write Bandwidth
Here we will measure the memory write bandwidth we can achieve from the CPU to the memory
and different levels of caches.
For inter-thread/core communication, we mostly care about memory/caches that are shared
across different cores (so L3 and main memory on all the systems tested).
However, testing this for other cache levels would also be useful,
both to peek into the internal of the CPU data path,
and for potentially adding thread local buffers
(say, to do some computation while waiting for the output from a different thread).
In this test, even though the goal is to figure out the bandwidth, we'll still keep the code relatively simple. There are potentially tricks (e.g. this one for reading from memory) that can give even higher bandwidth than the code here by access pattern. However, it is most likely that we'll do enough computation on each thread that this should not make a big difference.
The main test program is at cpu-write-bandwidth.cpp,
which allows starting a single thread to do the benchmark on a particular core (usually 0)
as well as other threads that creates similar memory load.
NOTE
lscpu since version 2.34 (commit) reports the total cache size for each level and type
rather than the size for each piece. In particular, Ubuntu 18.04 is using the old version
whereas Arch Linux is of course using the latest.
Be careful when interpreting the output.
-
We'll first start with only a single active thread. This thread should be able to use the cache for the whole system almost exclusively.
-
Intel Core i9-10885H
Cache sizes
Level L1dL2L3Size 32 KiB/core 256 KiB/core 16 MiB (shared) When running under powersave frequency governor.
Cache Level Buffer Size Bytes/ns Bytes/cycle Bytes/Cache Ref Cache Miss Rate L1d8 KiB 104.0 29.3 L1d16 KiB 108.8 30.5 L1d32 KiB 110.4 31.1 L264 KiB 66.5 18.6 L2128 KiB 66.5 18.6 L3512 KiB 35.8 10.0 29.8 0 % L31 MiB 34.2 9.6 27.6 0 % L32 MiB 33.9 9.5 27.5 0 % L33 MiB 33.7 9.5 27.5 0 % L34 MiB 33.4 9.4 27.4 0 % L35 MiB 32.3 9.1 27.4 1 % L36 MiB 31.6 8.9 27.7 1 % L37 MiB 30.2 8.5 28.4 2 % L38 MiB 30.3 8.5 28.5 2 % L310 MiB 29.3 8.2 28.6 3 % L312 MiB 27.8 7.8 28.5 6 % L314 MiB 25.9 7.3 28.5 10 % L316 MiB 23.1 6.6 28.4 18 % Main Memory 32 MiB 18.2 5.2 27.9 44 % Main Memory 64 MiB 15.4 4.3 27.5 60 % Main Memory 128 MiB 15.3 4.3 27.4 64 % In general, the performance decreases with the buffer size, which makes sense. For
L1dcache, the performance is higher for larger size most likely due to the size of the inner loop causing some overhead. The maximumL1dstore bandwidth achieved is very close to the32 Bytes/cyclethroughput between the store buffer and theL1dcache. The performance is basically flat for different buffer sizes likely because the loop overhead is now insignificant (compared toL1dcase). The bandwidth between theL1dandL2cache should in principle now limit our throughput but maybeL1disn't able to handle the communication with the store buffer (CPU core) and theL2cache simultaneously causing a drop of throughput almost in half.For both
L1dandL2, the cache references and misses count are basically zero, which agrees with the document forPERF_COUNT_HW_CACHE_REFERENCES(inperf_event_open(2)) that it is counting the references and misses to the last level cache (LLC), i.e.L3cache. The reference rate becomes significantly non-zero when the buffer overflowsL2cache and the bytes per reference roughly agrees with the32bytes wide bus between theL2cache and theL3cache. When the buffer has to be in the main memory, cache misses start to happen and the throughput is affected correspondingly (by roughly the cache miss rate).It is somewhat interesting that despite all being in the
L3cache, a larger buffer can still cause slightly worse bandwidth. It's also unclear to me what exactly is the limiting factor forL3bandwidth. One potential factor is that theL3cache isn't actually a single piece of memory but has slices attached to each core. Maybe a buffer big enough to not fit in the core's own slice is related to the slowdown. Or maybe it is related to the cache associativity?Inspired by the article linked above on
L2bandwidth, I also tested with the prefetchers disabled usingwrmsr -a 0x1a4 15. The results are,Cache Level Buffer Size Bytes/ns Bytes/cycle Bytes/Cache Ref Cache Miss Rate L1d8 KiB 104.3 29.3 L1d16 KiB 109.1 30.5 L1d32 KiB 111.3 31.2 L264 KiB 75.0 21.1 L2128 KiB 74.8 21.1 L3512 KiB 39.3 11.0 35.4 0 % L31 MiB 39.0 10.9 33.5 0 % L32 MiB 39.0 10.9 33.6 0 % L33 MiB 38.7 10.8 33.5 0 % L34 MiB 38.6 10.8 33.5 0 % L35 MiB 37.7 10.6 33.5 0 % L36 MiB 34.8 9.8 33.6 1 % L37 MiB 29.6 8.3 33.5 2 % L38 MiB 29.6 8.3 33.6 2 % L310 MiB 28.9 8.2 33.6 3 % L312 MiB 27.1 7.7 33.6 6 % L314 MiB 24.5 7.0 33.6 12 % L316 MiB 22.0 6.2 33.6 19 % Main Memory 32 MiB 11.5 3.3 32.4 85 % Main Memory 64 MiB 10.9 3.1 32.2 92 % Main Memory 128 MiB 10.7 3.0 32.2 96 % For
L1d, the frequency was a little higher (probably more to do with the CPU frequency governor and whether I'm blocking the fan than anything else...) but the bytes/cycle remains the same. There is a significant (14 %) increase in theL2throughput so it appears that the prefetcher is messing with that a little bit. TheL3and main memory range is more interesting. The bytes per cache reference is higher and much more consistent with the expected32bytes / cache ref. (The slightly lower cache reference count might come fromL2cache hit?) The bandwidths are plotted here.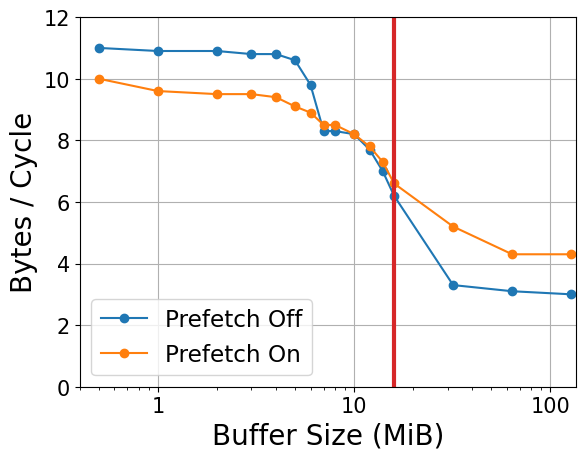
The
L3access performance is much more consistent without the prefetcher until a buffer size of about4 MiBto5 MiBwhen performance drops significantly in both cases and the prefetcher doesn't seem to have too much of an effect. When we exceed the size ofL3cache the prefetcher is definitely helping the performance. Maybe there is about4 MiBofL3cache that is actually fast to access for a core. Below this threshold, the prefetcher is occupying the bandwidth of this cache causing a slowdown when the core/L2cache tries to access it. When the buffer is bigger, maybe the prefetcher work is more spread out across caches that aren't tied to a core and theL3access is also slower in general so the effect of the slow down isn't as significant anymore.When running under performance frequency governor, which on my laptop set the frequency of the CPU to max, the test results becomes
Cache Level Buffer Size Bytes/ns Bytes/cycle Bytes/Cache Ref Cache Miss Rate L1d16 KiB 141.5 30.5 L2128 KiB 83.2 17.4 L34 MiB 45.5 9.4 27.4 0 % L312 MiB 36.4 7.6 28.5 4 % Main Memory 64 MiB 16.3 3.4 27.5 58 % For all cache levels, the bytes/cycle roughly maintains the same with the bytes/ns increases proportional to the frequency increase suggesting that the cache frequency is increased along with the core frequency. However, for the main memory, the bytes/ns increases only slightly whereas the bytes/cycle decreases significantly. This suggests that the main memory bandwidth is limited by the external bus frequency to the memory and not the CPU itself. Note that the slow down from
4 MiBto12 MiBdoes not change much. This may be evidence that whatever slow down here is within the CPU/cache and not with external memory (e.g. cache miss). -
Intel Core i7-6700K
Cache sizes
Level L1dL2L3Size 32 KiB/core 256 KiB/core 8 MiB (shared) When running under performance frequency governor.
Cache Level Buffer Size Bytes/ns Bytes/cycle Bytes/Cache Ref Cache Miss Rate L1d8 KiB 135.0 29.5 L1d16 KiB 140.9 30.6 L1d32 KiB 143.9 31.3 L264 KiB 85.5 18.6 L2128 KiB 87.3 19.0 L2256 KiB 64.1 13.9 59.3 0 % L3512 KiB 49.4 10.8 31.3 0 % L31 MiB 47.9 10.4 29.2 0 % L32 MiB 47.8 10.4 29.2 0 % L33 MiB 47.8 10.4 29.2 0 % L34 MiB 47.1 10.3 29.2 0 % L35 MiB 43.8 9.5 29.1 2 % L36 MiB 40.8 8.9 29.0 5 % L37 MiB 37.5 8.2 28.8 7 % L38 MiB 32.9 7.2 28.6 12 % Main Memory 10 MiB 27.6 6.0 28.1 21 % Main Memory 12 MiB 24.3 5.3 27.9 28 % Main Memory 16 MiB 20.6 4.5 27.7 38 % Main Memory 32 MiB 16.7 3.6 27.4 53 % Main Memory 64 MiB 15.3 3.3 27.2 59 % Main Memory 128 MiB 14.7 3.2 27.1 62 % This shows a very similar general trend. Both
L1dandL2cache shows a slightly better bytes per cycle and a slight increase in the performance larger size maybe because the CPU isn't able to high as much loop dependency and maybe also not doing as much (speculative) extra work that slows things down a little? (Could also be the prefetcher or sth else of course.) The maximumL1dstore bandwidth achieved is still very closed to the32 Bytes/cycle. The number of cache references is slightly lower, maybe due to a less aggressive prefetcher. It's interesting that the drop down of theL3performance also happens around4 MiBto5 MiB. Would still be interesting to figure out what causes it. It might have something to do with the core geometry in which case the AWG computer (i9-7900X) might have a different one and might show different results.The bandwidth achieved for the main memory is very similar to the i9-10885H. at least within 2x buffer size due to the
L3size difference. -
Intel Core i9-7900X
Cache sizes
Level L1dL2L3Size 32 KiB/core 1 MiB/core 13.75 MiB (shared) Cache Level Buffer Size Bytes/ns Bytes/cycle Bytes/Cache Ref Cache Miss Rate L1d8 KiB 213.1 53.4 L1d16 KiB 232.1 58.1 L1d32 KiB 243.2 60.9 L264 KiB 80.6 20.2 L2128 KiB 80.2 20.1 L2256 KiB 80.3 20.1 L2512 KiB 80.4 20.1 L21 MiB 45.8 11.5 169.3 0 % L32 MiB 27.2 6.8 64.7 0 % L33 MiB 27.0 6.8 64.0 0 % L34 MiB 27.0 6.8 64.0 0 % L35 MiB 27.0 6.8 64.0 0 % L36 MiB 26.6 6.7 64.1 0 % L37 MiB 22.1 5.5 64.5 0 % L38 MiB 21.8 5.5 64.5 1 % L39 MiB 21.8 5.5 64.5 1 % L310 MiB 21.8 5.5 64.5 3 % L311 MiB 21.6 5.4 64.5 5 % L312 MiB 21.6 5.4 64.5 7 % L313 MiB 21.4 5.4 64.5 10 % Main Memory 14 MiB 21.3 5.3 64.4 13 % Main Memory 15 MiB 20.9 5.2 64.4 17 % Main Memory 16 MiB 20.5 5.2 64.4 20 % Main Memory 32 MiB 15.4 3.9 64.6 59 % Main Memory 64 MiB 13.0 3.3 64.8 80 % Main Memory 128 MiB 12.1 3.0 65.0 90 % Main Memory 256 MiB 11.7 2.9 65.0 95 % So the
L1dbandwidth is much higher thanks to the wider bus from the write buffer (64 bytes). TheL2bandwidth is also somewhat higher (per cycle).L3and main memory bandwidth seems to be much lower (almost 2x forL3per cycle). The main memory bandwidth is also lower per ns but is still more than enough to saturate the total bandwidth if all 10 cores are in use. Maybe this is just optimized for multithreaded workload without giving a single core much more than what it needs in such cases. We'll see when we have other threads also working...The drop off in
L3bandwidth is also quite interesting and sharper than before. It's pretty much6.8 bytes / cyclefor6 MiBand below and5.5 bytes / cyclefor7 MiBand above. With slightly larger (1.375 MiB)L3cache per core the increase in the threshold makes sense compared to the previous tests. The sharper drop and the more constant value after the drop might be architectural or just due to the less workload from other processes on the computer. (The previous tests are on a computer with a GUI desktop environment running.)The cache miss rate is extremely high, almost as if the prefetcher isn't doing anything. I assume this is also related to optimizing for multithreaded workload where the cache miss from one thread can be hidden by the request from another thread to keep the hardware busy enough.
Despite the lower memory bandwidth to
L3and main memory, I think we should still have enough to make the thread compute bound as long as we are computing more than a few sine waves on each thread.
-
-
Next we'll compare this result with non-temporal stores. Still only a single thread.
For normal stores, the core (at least for x86 memory model) has to communicate about it with other cores via the cache and it is typically done (on intel CPU at least) by loading the cache line from memory, which one way or another allowing other cores to observe it, before writing to the loaded cache line. This is of course a waste if we are overwriting a whole cache line and especially if no one is concurrently looking at it. Because of this, x86 has a non-temporal write instruction which bypasses this and directly pushes the data to the memory without loading the cache line first. Unfortunately, this instruction also flushes the cache to memory so if the data can actually fit in the cache the performance will likely be lower. Ideally, what we want is an instruction that gives us an "empty" cache line (whatever content is fine as long as it doesn't read it from main memory) for us to write to. This is something that's supported on AArch64 by the
dc zvainstruction (zero cache line). Also note that on modern ARM cores, including Apple's M1, due to the more relaxed memory model, the CPU is able to optimize a normal store to non-temporal one when it sees fit. This does not seem possible so far on x86 due to the stronger memory model.The test program is at
cpu-nt-write-bandwidth.cpp, which is exactly the same ascpu-write-bandwidth.cppapart from the use of non-temporal stores when available.The "Ref Bandwidth" below is the performance for normal stores as measured above.
-
Intel Core i9-10885H
Powersave frequency governor. (Note that the "cache level" below is purely based on the cache size. With non-temporal stores, the buffer does not actually stay in the cache.)
Cache Level Buffer Size Bytes/ns Bytes/cycle Ref Bandwidth (Bytes) L1d16 KiB 40.0 11.3 108.8/ns, 30.5/cycle L2128 KiB 38.9 11.0 66.5/ns, 18.6/cycle L32 MiB 38.7 10.9 33.9/ns, 9.5/cycle L312 MiB 38.0 10.7 27.8/ns, 7.8/cycle Main Memory 128 MiB 37.2 10.5 15.3/ns, 4.3/cycle Setting the frequency governor has virtually no effect on the bandwidth and just increased the cycle count. The cache references and misses are all pretty much zero though there is a very small increase in their values (still less than
1 %from expected value) for large buffer size. This effect persists with the prefetcher turned off.Compared to the normal stores, the bandwidth is pretty much constant for all buffer sizes. On this machine, the normal store is faster when the buffer fits in
L2. They are about the same forL3size (depending on the exact size and the frequency of the CPU used) and the non-temporal store is clearly faster for writing to main memory. -
Intel Core i7-6700K
Powersave frequency governor.
Cache Level Buffer Size Bytes/ns Bytes/cycle Ref Bandwidth (Bytes) L1d16 KiB 33.2 7.3 140.9/ns, 30.6/cycle L2128 KiB 32.3 7.0 87.3/ns, 19.0/cycle L33 MiB 32.3 7.0 47.8/ns, 10.4/cycle L36 MiB 32.4 7.0 40.8/ns, 8.9/cycle Main Memory 128 MiB 32.8 7.1 14.7/ns, 3.2/cycle The cache references and misses behave very similarly to the previous test (almost zero but does increase for big buffer size). The comparison to normal stores is also very similar, the normal loads are faster or the same for things that fit in
L3but the non-temporal stores are much faster for writing to the main memory. -
Intel Core i9-7900X
Cache Level Buffer Size Bytes/ns Bytes/cycle Ref Bandwidth (Bytes) L1d16 KiB 23.3 5.9 232.1/ns, 58.1/cycle L2256 KiB 23.2 6.0 80.6/ns, 20.2/cycle L33 MiB 23.2 6.0 27.0/ns, 6.8/cycle L39 MiB 22.4 5.7 21.8/ns, 5.5/cycle Main Memory 16 MiB 22.4 5.7 20.5/ns, 5.2/cycle Main Memory 256 MiB 22.4 5.7 11.7/ns, 2.9/cycle The cache references and misses behaves still fairly similar to the previous tests, though the reference count only starts to increase for the last one (not for the
16 MiBone). Since theL3bandwidth is lower for normal stores, the non-temporal stores already win for medium buffer size that can still fit inL3. Interestingly, the threshold when the normal store toL3experiences a drop in throughput is also where the non-temporal one has a drop (much smaller but still significant) as well. Since the non-temporal store shouldn't talk to the cache as much, maybe it's related to the core talking to different memory controllers?
Do note that even though we say we have higher bandwidth writing to some buffer sizes using non-temporal stores compared to normal stores, this doesn't necessarily mean we always want to use this when writing to memory. For example, if the result is to be read again soon (by the same or another thread) non-temporal store might cause a longer latency on the load. This should still be useful, though, when we write to memory that is only meant to be read by another device (e.g. GPU, or the AWG PCIe card). Some of these will of course be very driver dependent.
-
-
Normal write bandwidth with other busy threads. As mentioned above, all the threads should be writing to buffers of the same size, and they should be doing that throughout the benchmark.
-
Intel Core i9-10885H
Powersave frequency governor.
For the raw data, see these CSV files for using normal stores, with the prefetcher disabled, and with non-temporal stores.
For small buffer sizes that can fit into the cores' private cache:

We can see that adding additional threads have minimal effect on the performance. The normal one does show some variation for the
L2cache and this is clearly mostly caused by prefetcher which also decreases the performance forL2buffer size. However, even with the prefetcher disabled having a buffer half theL2size still has slightly lower performance in some cases.When the buffer is big enough to require shared cache (
L3) or the main memory:
We can see that the total bandwidth to
L3increases with each additional thread but scales slightly sub-linearly and caps at about200 GB/s. However, with hitting the main memory, the total bandwidth remains at about20 GB/swith little dependency on the number of threads. Given that a normal store to the main memory requires loading of the cache line before writing back, this is very close to the theoretical maximum of22.9 GB/s.With the prefetcher disabled, the performance to
L3is slightly increased for all thread count and also seems to be more consistent for different buffer sizes. It significantly decreases the single thread performance to the main memory as we've seen earlier but has little effect with multiple threads likely because the other threads are hiding the cache miss latency.Looking at the cache miss rate:

We see a similar trend where the prefetcher increases the cache miss rate slightly when the buffer can fit in the
L3but significantly decreases the cache miss for main memory. This is especially true with fewer threads.Finally, we look at non-temporal stores:

The result is mostly flat with some small variation (note that the peak in the bytes/cycle near
14 MiBbuffer size is likely a core frequency downscaling and may not be significant.) It is somewhat interesting that the performance achieved for7threads is consistently worse than all other cases though the difference is still only about20 %. The achieved rate of about37 GB/sis also fairly closed to the theoretical maximum of45.8 GB/s. -
Intel Core i7-6700K
Powersave frequency governor.
For the raw data, see these CSV files for using normal stores, with the prefetcher disabled, and with non-temporal stores.
For small buffer sizes that can fit into the cores' private cache:

Very similar to the previous test. The normal one does still show more variation due to the prefetcher though it's a bit interesting that the 2 and 3 threads version has the lowest L2 throughput per thread even with prefetcher off.
When the buffer is big enough to require shared cache (
L3) or the main memory:
There's almost no cap for the
L3bandwidth this time and the scaling to 4 threads is fairly linear. The maximum bandwidth achieved is very similar to what we had previously. For the main memory, the total bandwidth remains at about15 GB/s, which is very close to the theoretical maximum of17 GB/s.The prefetcher disabled still seems to decrease performance within
L3but improves it for a single thread in main memory.Looking at the cache miss rate:

This time the prefetcher seems to decrease the cache miss rate overall. (Note that this could be due to a higher reference count rather than a lower miss count.)
Finally, we look at non-temporal stores:

The trend is very similar (flat). However, it also seems that more threads negatively affect the performance especially for intermediate buffer sizes. There also seems to be some frequency scaling going on as the frequency for the single thread is
4.1 GHzwhereas it is4.6 GHzfor the multithread one. In any case, the maximum rate achieved is about32 GB/s, very closed to the theoretical maximum of34.1 GB/s. -
Intel Core i9-7900X
Since the memory used in the computer is
DDR4-2133not the maximum rateDDR4-2666, the theoretical bandwidth should be about68 GB/srather than85 GB/sas listed on Intel ARK.For the raw data, see these CSV files for using normal stores, with the prefetcher disabled, and with non-temporal stores.
For small buffer sizes that can fit into the cores' private cache:

The prefetcher has almost no effect this time.
When the buffer is big enough to require shared cache (
L3) or the main memory:
Given the very small gap between the total
L2(10 MiB) andL3(13.75 MiB) size it is hard to measureL3bandwidth this time without a significant effect fromL2. We'll probably have to use core-to-core communication bandwidth for that. This is why high thread count lines do not have points withinL3and this likely causes the maximum totalL3bandwidth shown to be lower than the real value. In general, the prefetcher seems to be mostly helping here, and especially for main memory of course. It's also very clear that one or two cores is not enough to saturate the bandwidth to any shared cache/memory and the prefetcher helps here for 3 threads and above. The maximum bandwidth achieved is about27 GB/s, slower than the theoretical maximum of34 GB/s.Looking at the cache miss rate:

The rate is pretty high with or without the prefetcher.
Finally, we look at non-temporal stores:

The lines are still very flat. However, similar to normal stores, at least three threads must be used (in fact, three threads seems to achieve the best performance here) in order to saturate the store bandwidth. The maximum bandwidth achieved is about
60 GB/swhich is in between the deviation from the theoretical max of68 GB/scompared to the previous ones.
In general, the results roughly match what I was expecting and we see very similar effects on different CPUs but with different importance. It's nice that the prefetcher has minimal negative effect with multiple threads for
L3cache and we can achieve about80 %to95 %of the theoretical memory bandwidths in all tests. It's a bit unfortunate that the server CPU (i9-7900X) isn't able to achieve a higher bandwidth with a single thread and that the memory type was limiting the throughput. At least this is something that we can fix by changing the memory though.As for what tricks we can play with given the results, if we are writing to the memory for some other devices to read, we almost certainly want non-temporal write (assuming the driver doesn't mess us up). The
L1dandL2bandwidth is also so much higher that we could potentially use them to store some computational results as we are waiting for input data. -
Next we'll add another core/thread to the picture and measure the core-to-core communication bandwidth using a ring buffer between two threads.