COVID19 Tweets 🌎 Geographical Deep Analysis
Visit My Kaggle Notebook Now
In this Analysics I used opensource kaggle Dataset Gatered through Twitter API
and Word world-cities-datasets to compare and map and concat unique cities precent in this Dataset as twitter gave complete location for the users
I'm Safdar Khan a software Engineer who is working on AI and Datascience. If you face any problem you can contact with me.
📦Covid19-tweets-analysics
┣ 📂code
┃ ┣ 📜covid19-tweets-geographical-deep-analysis.ipynb
┃ ┗ 📜reame.md
┣ 📂Images
┃ ┣ 📜10 Countries With Lest Tweets.png
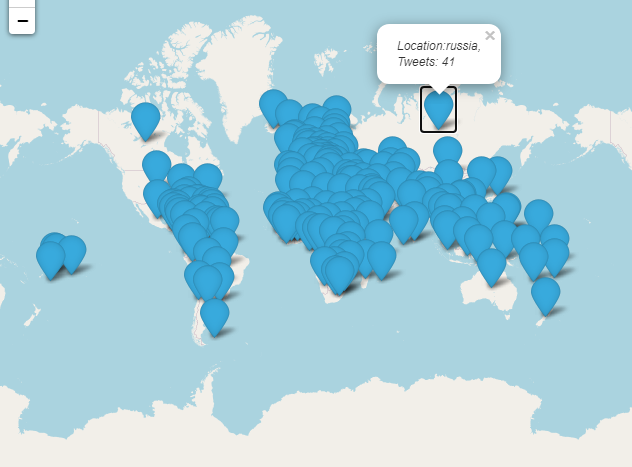
┃ ┣ 📜Clicable Geo Map.png
┃ ┣ 📜Clickable Geo Map 2.png
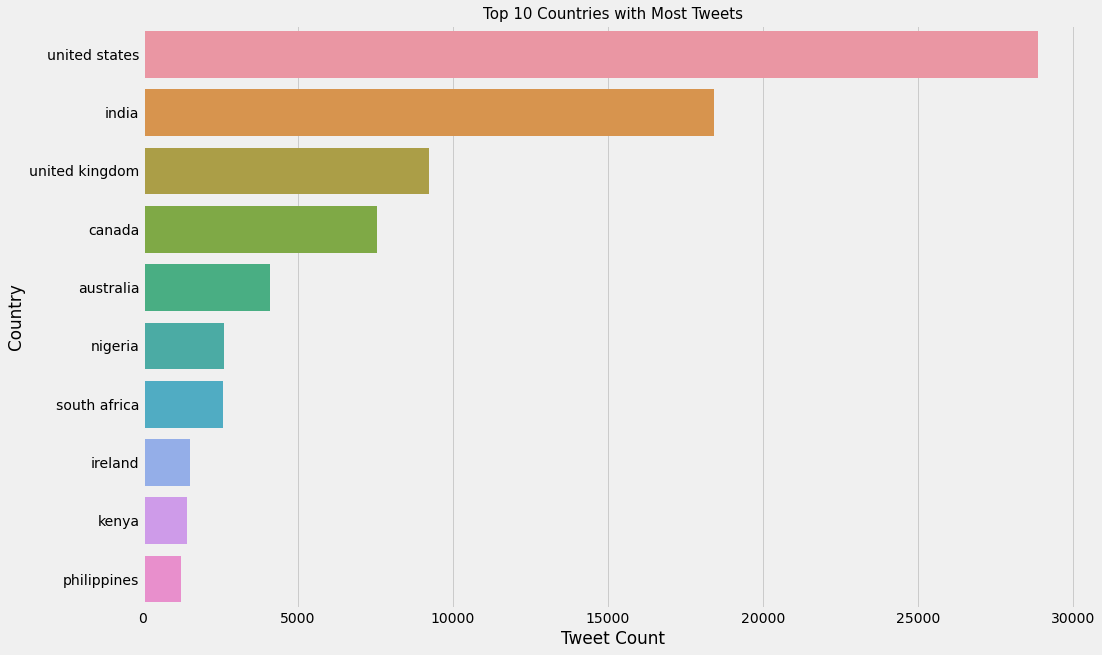
┃ ┣ 📜Top 10 Countries With Most Tweets.png
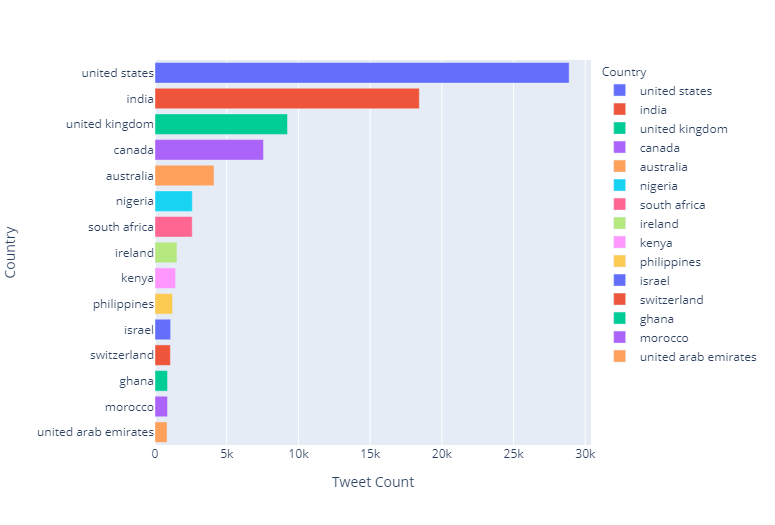
┃ ┗ 📜Tweets Per country Limit By 15 With Gediant View.png
┣ 📂input
┃ ┣ 📂covid19-tweets
┃ ┃ ┗ 📜covid19_tweets.csv
┃ ┗ 📂world-cities-datasets
┃ ┃ ┗ 📜worldcities.csv
┣ 📜LICENSE
┗ 📜README.md
This Open source Project is for best visualization of Large Data Over Geograpgical Data, Mapping of 2 Datasets, Remove and Handle NaN/ Null Values and Get Unique Data Results. This Project is a demonstration of Covid-19 Dataset Task
Geo Graphical Analysics and Visualization of Covid-19 Tweets "source Kaggle"

Geo Map Showing 193 Locations over 77910 Valid Tweets of 179108 Data rows
- Data and library loading
- Visualizing and Understading of Data
- Preprocessing/Data Cleaning
- Data Viualization
- Valid Tweets
- Top 10 Countries with Most Tweets
- 10 Countries with Least Tweets
- Top 15 Countries with Most Tweets Diffrent
- Representation
- Geo-MAP
- Conclusion