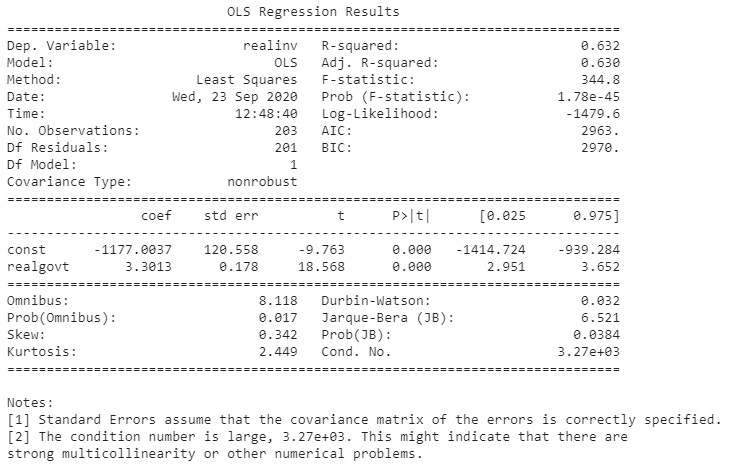
Use Linear Regression to predict gross private domestic investment from an independent variable X of federal consumption expenditures & gross investment.
Data Description Below
Number of Observations - 203
Number of Variables - 14

Variable name definitions::

    year      - 1959q1 - 2009q3
    quarter   - 1-4
    realgdp   - Real gross domestic product (Bil. of chained 2005 US$,
                seasonally adjusted annual rate)
    realcons  - Real personal consumption expenditures (Bil. of chained
                2005 US$, seasonally adjusted annual rate)
    realinv   - Real gross private domestic investment (Bil. of chained
                2005 US$, seasonally adjusted annual rate)
    realgovt  - Real federal consumption expenditures & gross investment
                (Bil. of chained 2005 US$, seasonally adjusted annual rate)
    realdpi   - Real private disposable income (Bil. of chained 2005
                US$, seasonally adjusted annual rate)
    cpi       - End of the quarter consumer price index for all urban
                consumers: all items (1982-84 = 100, seasonally adjusted).
    m1        - End of the quarter M1 nominal money stock (Seasonally
                adjusted)
    tbilrate  - Quarterly monthly average of the monthly 3-month
                treasury bill: secondary market rate
    unemp     - Seasonally adjusted unemployment rate (%)
    pop       - End of the quarter total population: all ages incl. armed
                forces over seas
    infl      - Inflation rate (ln(cpi_{t}/cpi_{t-1}) * 400)
    realint   - Real interest rate (tbilrate - infl)
X = realgovt
y = realinv
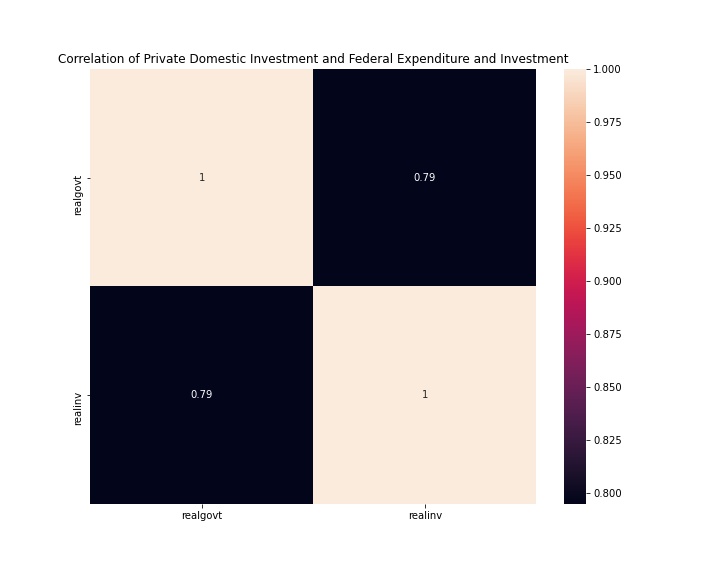
realinv - Real gross private domestic investment (Bil. of chained
2005 US$, seasonally adjusted annual rate)
realgovt - Real federal consumption expenditures & gross investment
(Bil. of chained 2005 US$, seasonally adjusted annual rate)
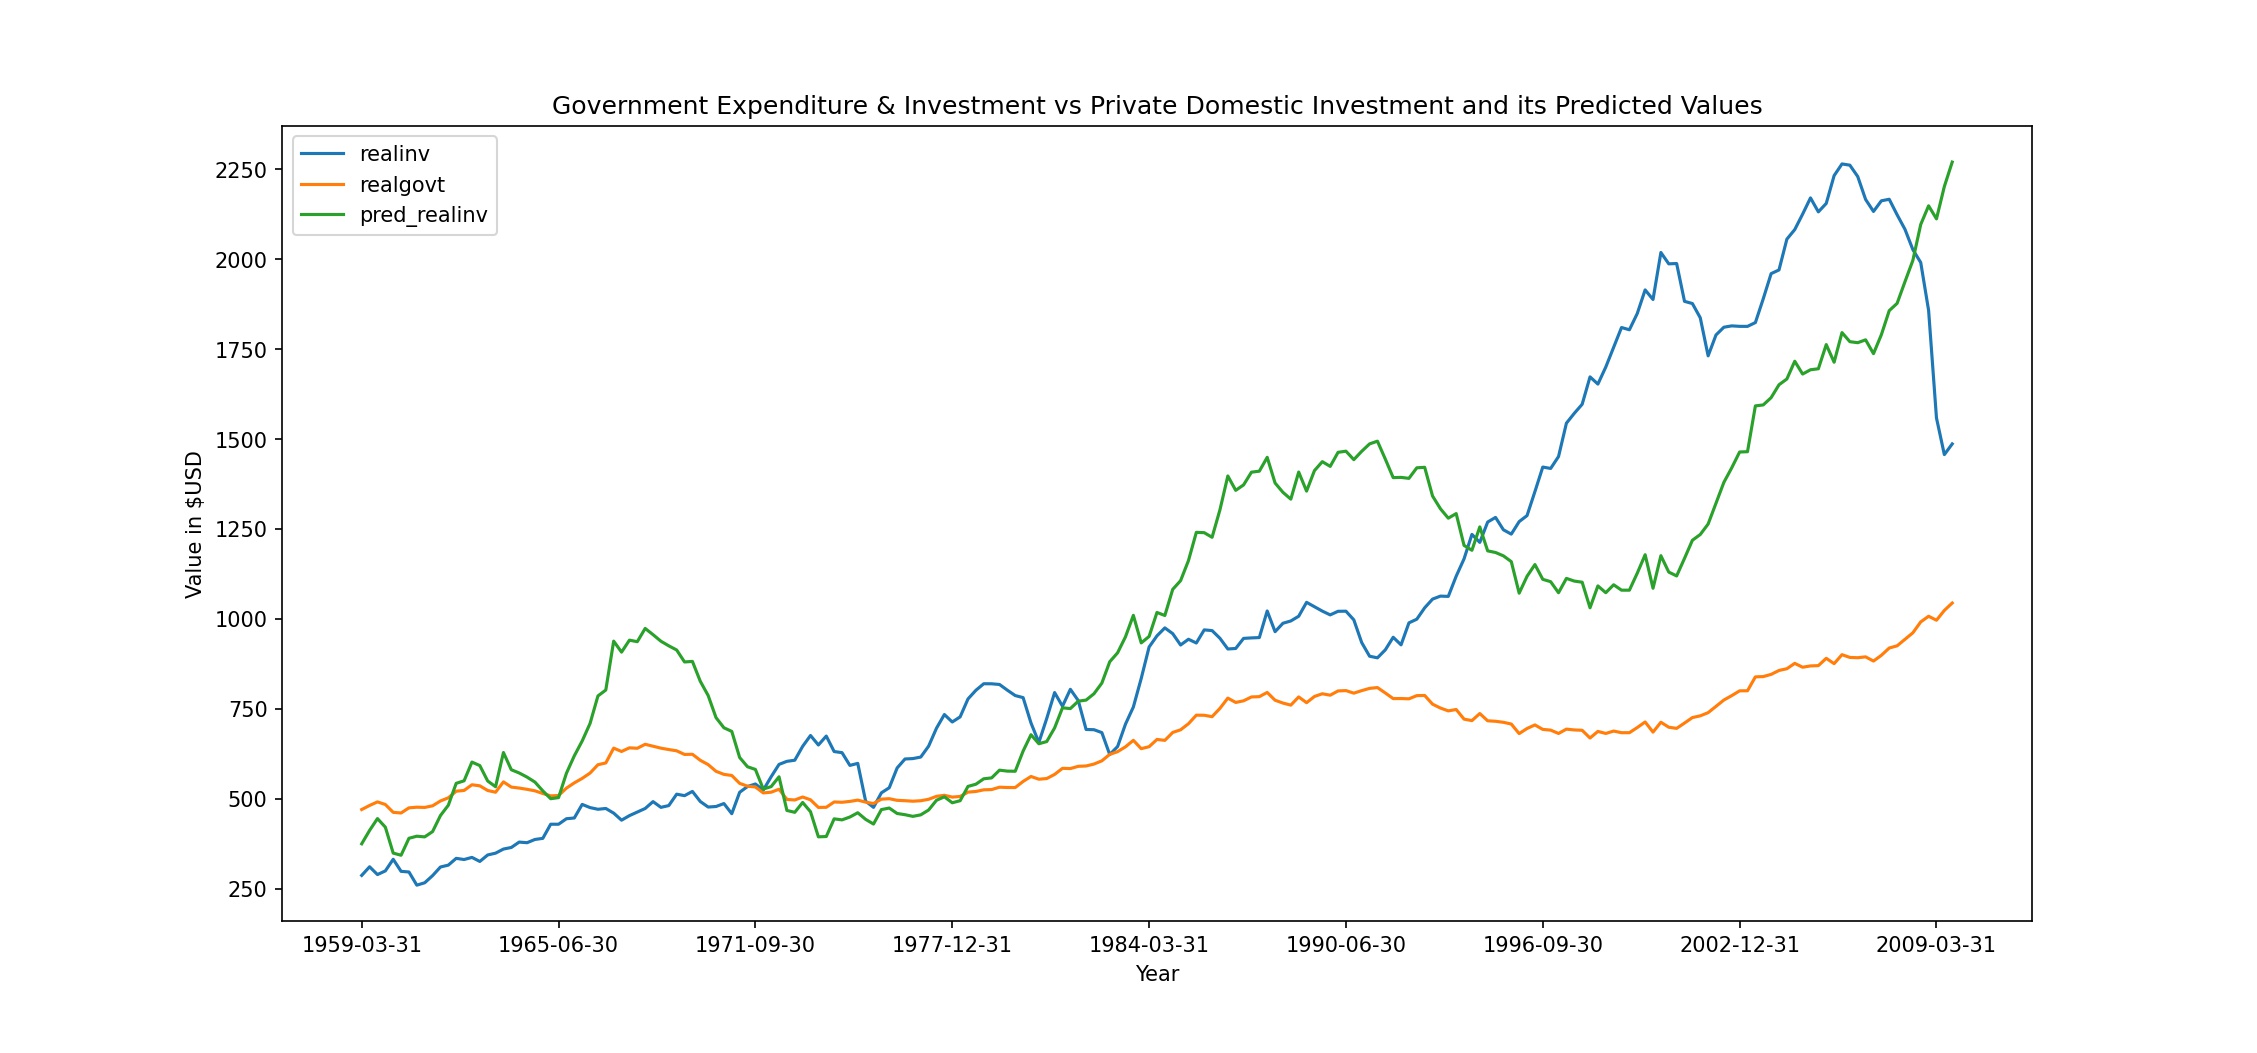
-We are trying to predict private domestic investment based on government expenditure and investment.
-We can see the prediction values of private domestic investment somewhat matches the curve of the actual government expenditure.
-There are varying dips in private domestic investments where there is a spike in actual government expenses.
-From the 2002 Dot-Com Bubble and the 2008 financial crash, there was a great dip in private domestic investment. However, Government Expenditure and Investments rallied on.
-The prediction values fail to capture the varying dips as they are only considering the government investment and expenditure which had a subtle increase during that period.
-The model is therefore too Linear in that it follows closely with its Independent X to predict the dependent Y inorder to get the values for the yhat.
-The linear nature of the model cannot capture the non-linear nature of real-world events like the 2002 Dot-Com Bubble and the 2008 Great Recession.
-Try and explore a non-linear model to capture the subtleties of non-linearity.
-We will explore time-series analysis as an alternative.
Feel Free to follow me: