Mapping and charting pixels from remote sensing Earth observation data with JavaScript.
https://jwasilgeo.github.io/pixels/charting/
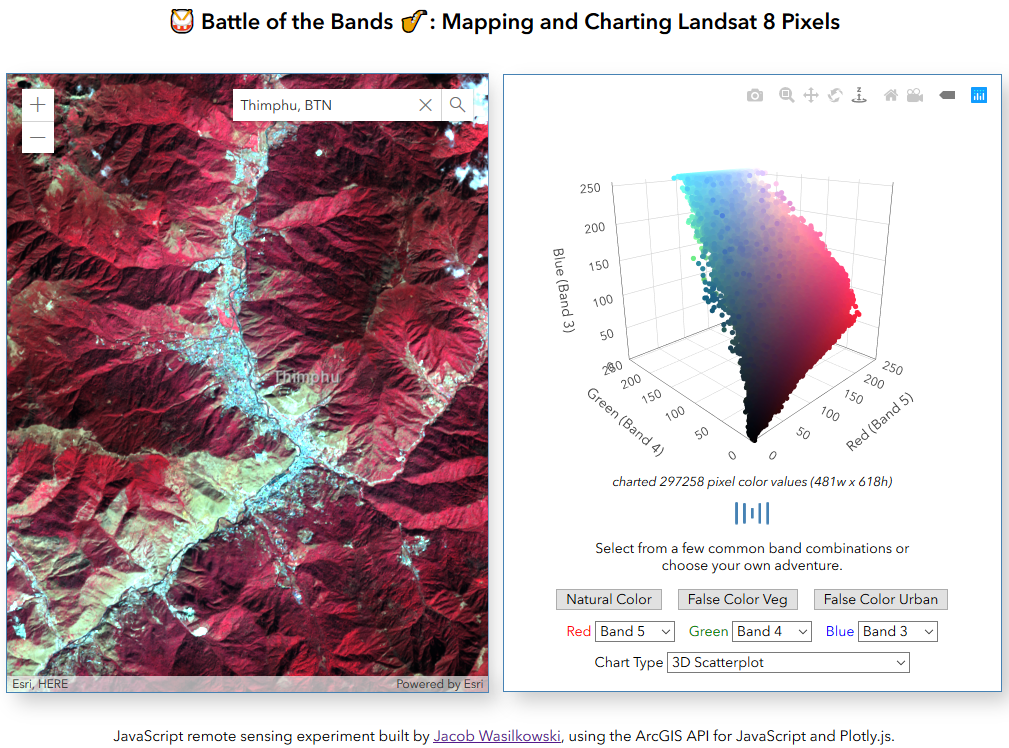
Histograms and 3D scatterplots of R, G, B pixel values. Choose your own Landsat 8 band combinations to explore the data.
Thanks to https://github.com/Overv/ColorScatterPlot for some helpful ideas when I was unsure how to assign colors my 3D scatterplot markers in Plotly.js.
Warning ¯\_(ツ)_/¯
Future goals:
-
filter by time frame window
-
filter by cloud cover
-
add toggling ability to run in a "raw" mode, where:
- turn off DRA in the request
- map and chart the apparent reflectance raw values 0-10000 from the Landsat service
(unfinished business / work in progress)
Draw polygons to fetch pixel data about your training sites.
Future goals:
- feed training sites info into imagery algorithms in the browser
(unfinished business / work in progress)
Some trials and benchmarks for calculating and displaying 8bit ndvi from NIR and red bands in a web map on-the-fly in the browser. This includes some truly messy pieces of code for both Esri JSAPI and OpenLayers.js.
Future goals:
-
report data crunching benchmarks times in a component
-
explain some of the differences and findings