0. Introduction of data to be downloaded
The most important changes between HG19 and HG38 are the immune genes
Stage definiation: Because each cancer type has its own classification system, letters and numbers do not always mean the same thing for every kind of cancer. Once the T, N, and M are determined, they are combined, and an overall stage of 0, I, II, III, IV is assigned. Sometimes these stages are subdivided as well, using letters such as IIIA and IIIB.
There are several kinds of RNA-Seq level 3 result available on firebrowse. They are:
- .junction_quantification.txt
- .rsem.genes.results
- .rsem.isoforms.results
- .rsem.genes.normalized_results
- .rsem.isoforms.normalized_results
- .bt.exon_quantification.txt
Among those results, I only focus on gene level results. It's the .rsem.genes.normalized_results and .rsem.genes.results.
The transcript expression level are quantified by two different method in the .rsem.genes.results. For each samples, we can see two columns here, which are raw_count and scaled_estimate. Normlized count result is stored in the .rsem.genes.normalized_results table.
NOTE: At gene level, expression is simply the sum of the expression of all possible isoforms. well explained
-
raw_count: The estimated number of fragments derived from a given gene. (This value is not an integer because RSEM only reports a guess of how many reads belong to a transcript/gene)
-
normalized count: The raw count divided by the 75th percentile of the column (after removing 0) and then multiply by 1000.
-
Most TCGA papers use the log-transformed "normalized_count" in their analyses.
-
-
scale_estimate: The fraction of transcripts made up by a given gene.


On the notion that regions containing driver events should be altered at higher frequencies than regions containing only passengers, this tool identifies likely driver SCNAs (Somatic copy-number alterations) by evaluating the frequency and amplitude of observed events.
Challenges:
- The abundance of SCNAs in humam cancers varies accoridng to their size. Chromosome-arm length SCNAs occurrs much more fequently than SCNAs of smaller size. (Beroukhim R, et al.m Nature. 2010.)
- Above observation indicates that analysis methods need to model complex cancer genomes with SCNA types occurring at distinct background rates. GISTIC in Firebrowse Gistic in our GDAC pipeline now operates upon the last of these: scna_minus_germline_cnv_hg19__seg May 2012
Output: Broad or Focal: Identifies whether the region reaches significance due primarily to broad events (called “broad”), focal events (called “focal”), or independently significant broad and focal events (called “both”).
The data were downloaded from Xenas, where combine samples by cancer types.
Process workflow:
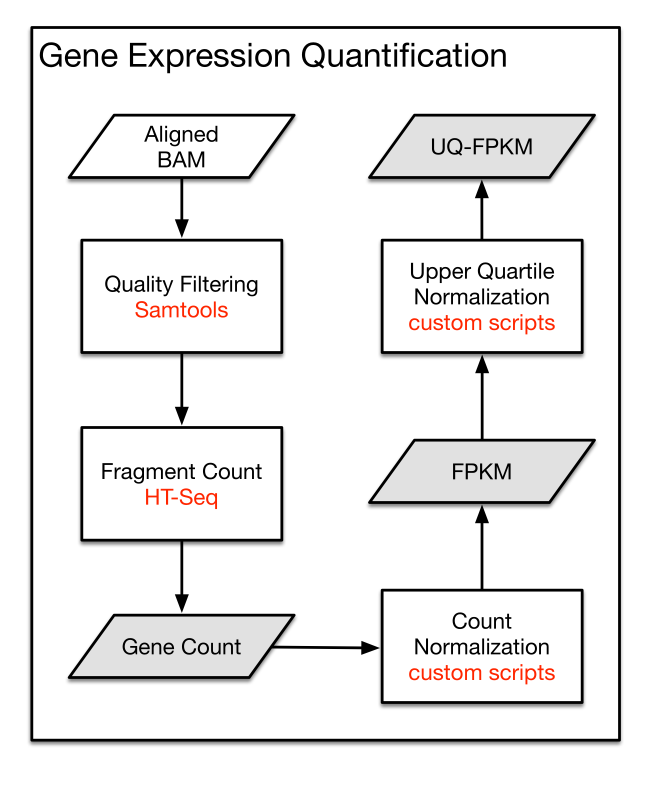
Description of each type of file available for download in GDC:
| Type | Description | Format |
|---|---|---|
| Raw Read Counts | The number of reads aligned to each gene, calculated by HT-Seq | TXT |
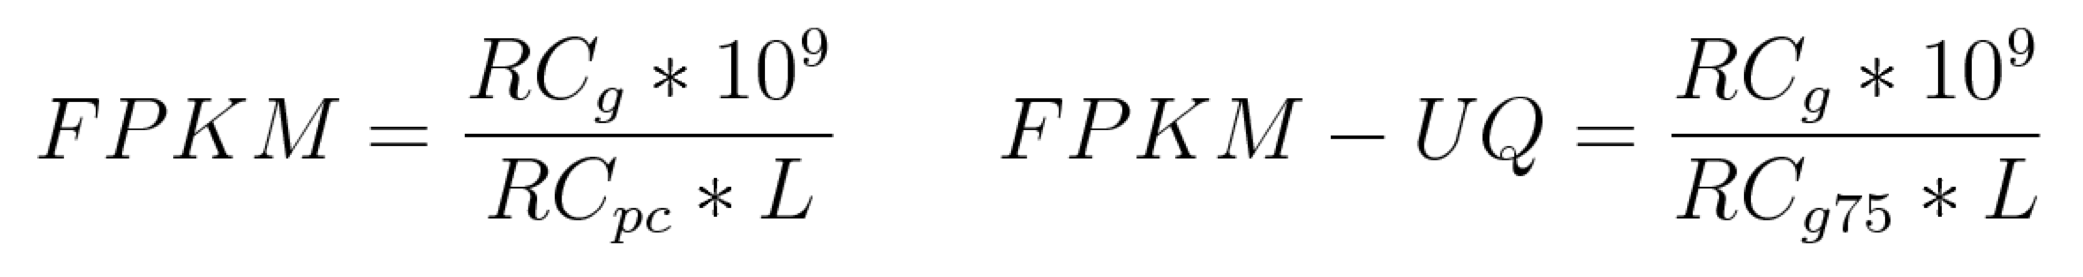
| FPKM | A normalized expression value that takes into account each gene length and the number of reads mapped to all protein-coding genes | TXT |
| FPKM-UQ | A modified version of the FPKM formula in which the 75th percentile read count is used as the denominator in place of the total number of protein-coding reads | TXT |
-
RCg: Number of reads mapped to the gene
-
RCpc: Number of reads mapped to all protein-coding genes
-
RCg75: The 75th percentile read count value for genes in the sample
-
L: Length of the gene in base pairs; Calculated as the sum of all exons in a gene
The copy number variation (CNV) pipeline uses Affymetrix SNP 6.0 array data to identify genomic regions that are repeated and infer the copy number of these repeats. This pipeline is built onto the existing TCGA level 2 data generated by Birdsuite and uses the DNAcopy R-package to perform a circular binary segmentation (CBS) analysis. The final output files are segmented into genomic regions with the estimated copy number for each region. The GDC further transforms these copy number values into segment mean values, which are equal to log2(copy-number/ 2). Diploid regions will have a segment mean of zero, amplified regions will have positive values, and deletions will have negative values.
Numeric focal-level Copy Number Variation (CNV) values were generated with "Masked Copy Number Segment" files from tumor aliquots using GISTIC2 on a project level. Only protein-coding genes were kept, and their numeric CNV values were further thresholded by a noise cutoff of 0.3:
- Genes with focal CNV values smaller than -0.3 are categorized as a "loss" (-1)
- Genes with focal CNV values larger than 0.3 are categorized as a "gain" (+1)
- Genes with focal CNV values between and including -0.3 and 0.3 are categorized as "neutral" (0).