The purpose of this repository is to explore both the relationships between discrete cosine transform (DCT) coefficients as well as the variation in DCT coefficients across popular video codecs with a focus on improving and optimizing DCT-based steganographic systems. The primary focus of this repository is on variation histograms and correlation heatmaps (explained below).
Note: In order to remain consistent with OpenCV, color channels are discussed with the BGR ordering rather than RGB unless otherwise stated.
In stats, there are a number of ready-to-go output files. Further, the visualizations yielded by visualize.py with stats/stats_2_2_0_0_large.json can be found saved in png format in figures and are featured in this README. The calculated statistical information found in stats was derived from two base videos.
Filenames ending in _small are derived from 3 minutes and 52 seconds of video downloaded from YouTube across h.264, h.265, mpeg4, and vp9 codecs with varrying compression settings.
Filenames ending in _large, on the other hand are derived from 1 hour, 37 minutes, and 20 seconds of video downloaded from YouTube in h.264, h.265, mpeg4, and vp9 codecs with the default compression settings of ffmpeg used for all except for the h.264 encoded video, which (to the best of my knowledge) is compressed with the settings used by YouTube.
All calculations and video processing is done in stats_calc.py. Calculation output is given as a dictionary written to a file in json format. Values of the ouptut dictionary are as follows:
- lowest_variation -> List[int] -> List of 3 integers which record the lowest observed variation for each of the respective color channels. These will almost always be zero.
- highest_variation -> List[int] -> List of 3 integers which record the highest observed variation for each ofthe respective color channels.
- variation_hists -> List[List[int]] -> Variation histograms for each color channel. A more detailed explanation can be found below.
- lowest_val -> int -> The lowest observed value of the primary DCT coefficient across all color channels.
- highest_val -> int -> The highest observed value of the primary DCT coefficient across all color channels
- block_count -> int -> Number of 8x8 DCT blocks that where processed.
- function_of_dct_2_hists -> List[List[List[int]]] -> Correlation heatmaps for each color channel. A more detailed explanation can be found below.
The usage for stats_calc.py is as follows:
python3 stats_calc.py <videos_directory> <x1> <y1> <x2> <y2>
- videos directory : str : directory containing a video saved with different codecs
- x1, y1 : int in the interval [0, 7] : indicate the frequency indecies for the primary DCT coefficient.
- x2, y2 : int in the interval [0, 7] : indicate the frequency indecies for the secondary DCT coefficient.
The calculated results are written to the stats directory in the format of stats/stats_x1_y1_x2_y2_video_directory.json
In order to visualize that information extracted by stats_calc.py, this repository provides visualize.py, which plots variation histograms and correlation heatmaps for each color channel from a given json file. The usage is as follows:
python3 visualize.py <json_filename>
- json filename : string : filename of json output from
stats_calc.py.
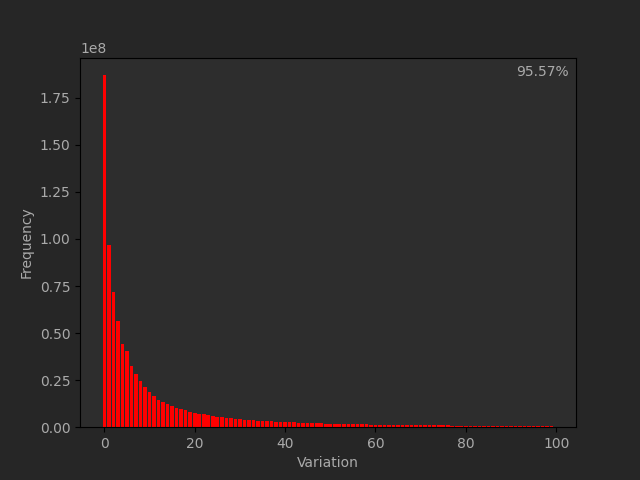
For the purpose of this analysis, the variation of a DCT coefficient for a given block of a video frame is defined as the absolute value of the difference between the smallest and largest value for that coefficient in that block across all analyzed video codecs. For example, if the analyzed DCT coefficient in a given block is observed to have values of 155, 240, 155, and 167 across each analyzed codec respectively, the variation is calculated as abs(155 - 167) = 12.
Variation histograms plot the variation of the primary DCT coefficient on the horizontal axis with the observed frequency of that variation on the vertical axis.
It is important to note that visualize.py does not plot the entire variation histogram, rather it cuts the plot off at 100 on the horizontal axis and displays what percentage of the overall variation count the displayed graph represents in the top right corner of the plot.
Below are example figures that can be found in the figures directory. These histograms were derived from stats/stats_2_2_0_0_large.json and as such, display the variation histograms of the DCT coefficient (2, 2) in the blue, green, and red color channels respectively.


Correlation heatmaps aim to visualize the relationship between the primary DCT coefficient and secondary DCT coefficient in a specific color channel. H[i][j] records the number of times that a primary coefficient value of j was observed when the primary coefficient was observed to have a value of i. Below are example figures that can be found in the figures directory. These heatmaps were derived from stats/stats_2_2_0_0_large.json and as such, display the relationship between the DCT coefficients (2, 2) and (0, 0) in the blue, green, and red color channels respectively.


- Better standardization and documentation of videos from which the data and visualizations are derived.
- Possibly the largest outstanding improvement would be to find an efficient way to store calculated DCT coefficients in an intermediary format. Though such files would likely be quite large without the use of lossy compression, the time savings of such a system would be enormous. The vast majority of time spent on this project so far has been spent waiting for
stats_calc.pyto grind through the DCT computations for each frame every time a change was made or additional information needed to be extracted. Alternatively, if the DCT coefficients could be taken directly from inter-frame encoded p-frames or something similar, that would also lead to dramatic improvents in the compute time forstats_calc.py.