Plot survey results from a Likert scale survey.


Present your survey results with a nice graphic!
- R installed
- R package HH
- survey results in csv
-
Plots a Likert scale graphic with csv - file
- groups items together according to "Group"
- generates an eps graphic
-
csv file, e.g. Group, Question, "Strongly Disagree", Disagree, Neutral, Agree ,"Strongly Agree"
User, This is a question, 1, 3, 2, 4, 5
Usage: ./r-likert.sh r-likert.R survey-results.csv-
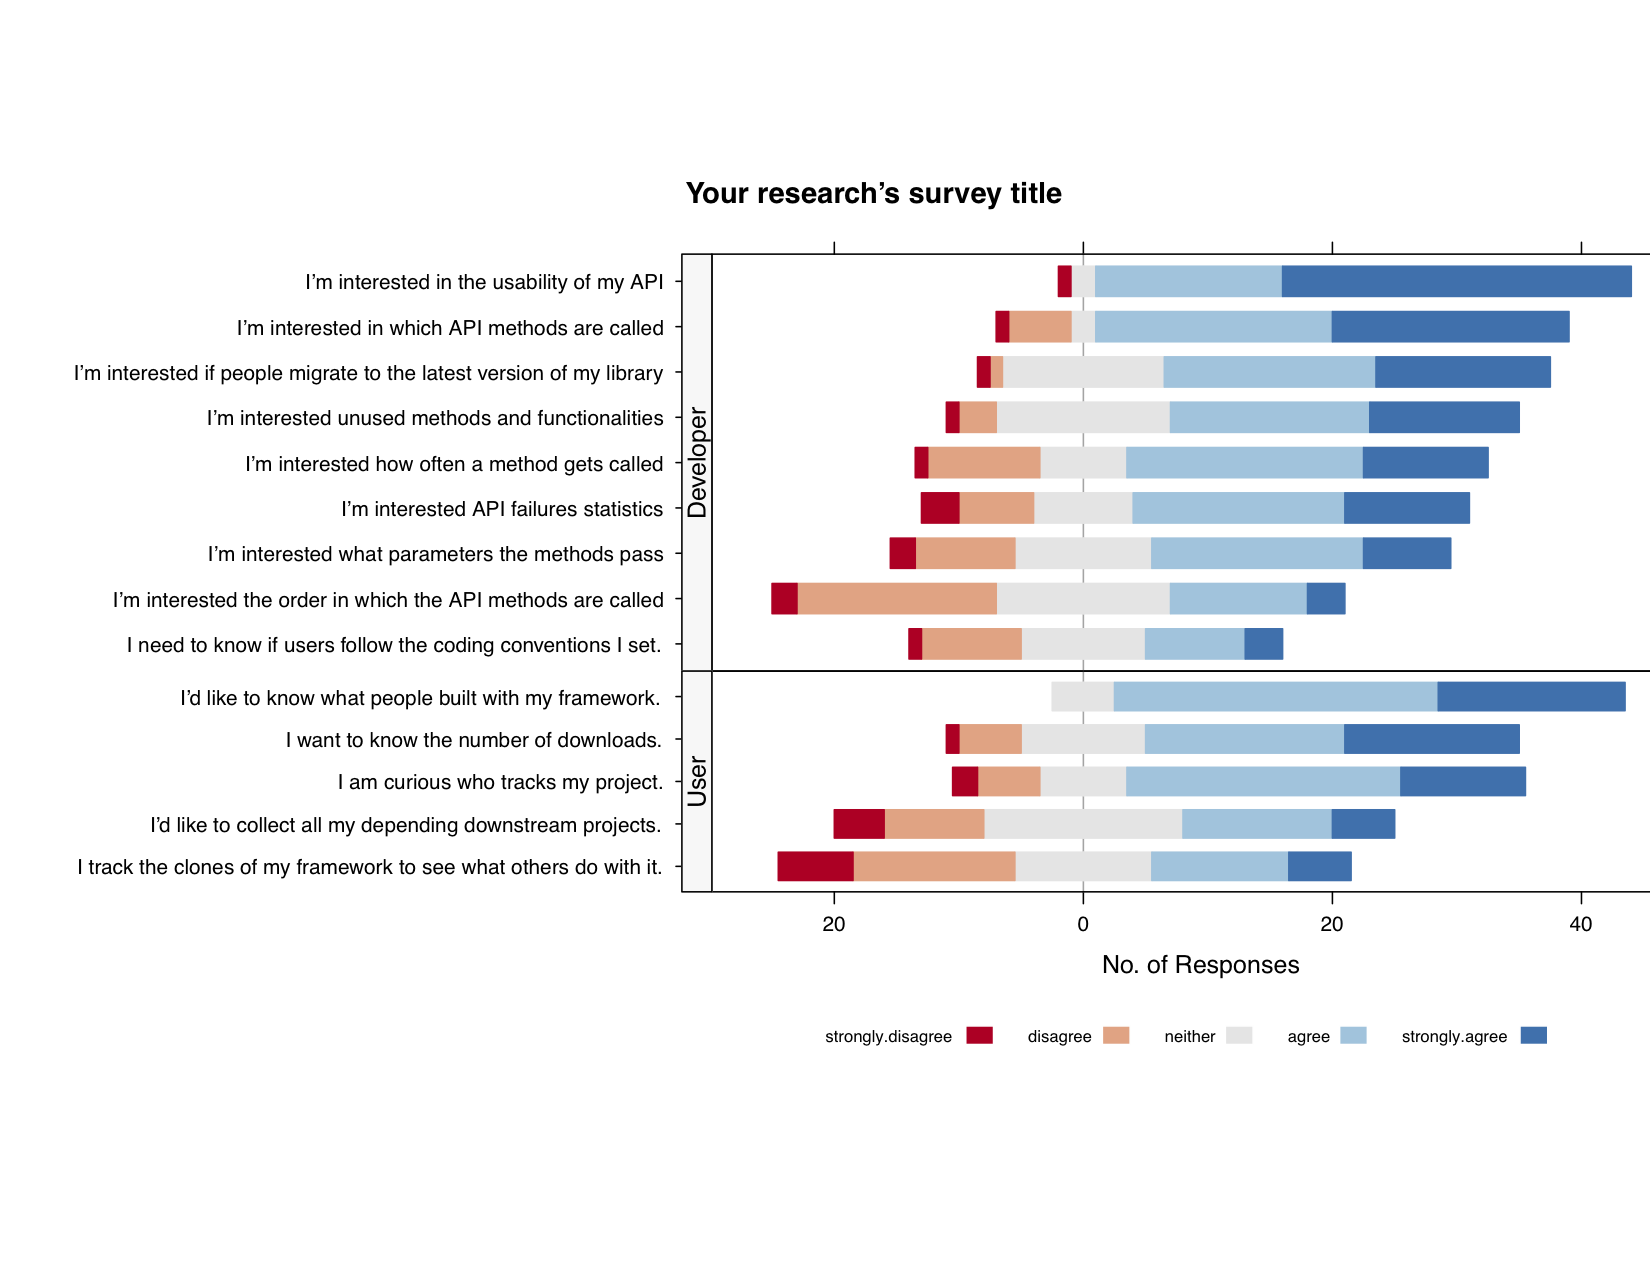
This is an example survey results as a Likert plot:
-
This is an example survey results as a Likert plot.
This project is licensed under the MIT License - see the LICENSE.md file for details