Models ~ vbatDispatch
This model returns the expected savings of using thermostatically controlled loads in demand response programs. The underlying device model is PNNL's VBAT, which calculates the energy potential for thermal loads, an energy demand, and temperature settings. The results are outputted in three parts: the VBAT Energy Available & Demand Impact, shows a range of how much power could be saved over a year long period, the state of charge of the virtual battery, the unadulterated demand, demand after vbat reductions to achieve monthly peak shaving, and power actually dispatched; the second, Monthly Cost Comparison, shows a breakdown of demand, energy, energy cost, demand charge, total cost, and savings on a monthly basis to compare cost and performance of the system without and with VBAT; the third, Cash Flow Projection shows the yearly cashflows as well as the overall balance.
Run the model here: https://omf.coop/newModel/vbatDispatch/wiki
The model requires the user to select the load type. Default values for the temperature settings are automatically loaded based on the device used, but can be changed. The next six parameters are for the financial analysis.
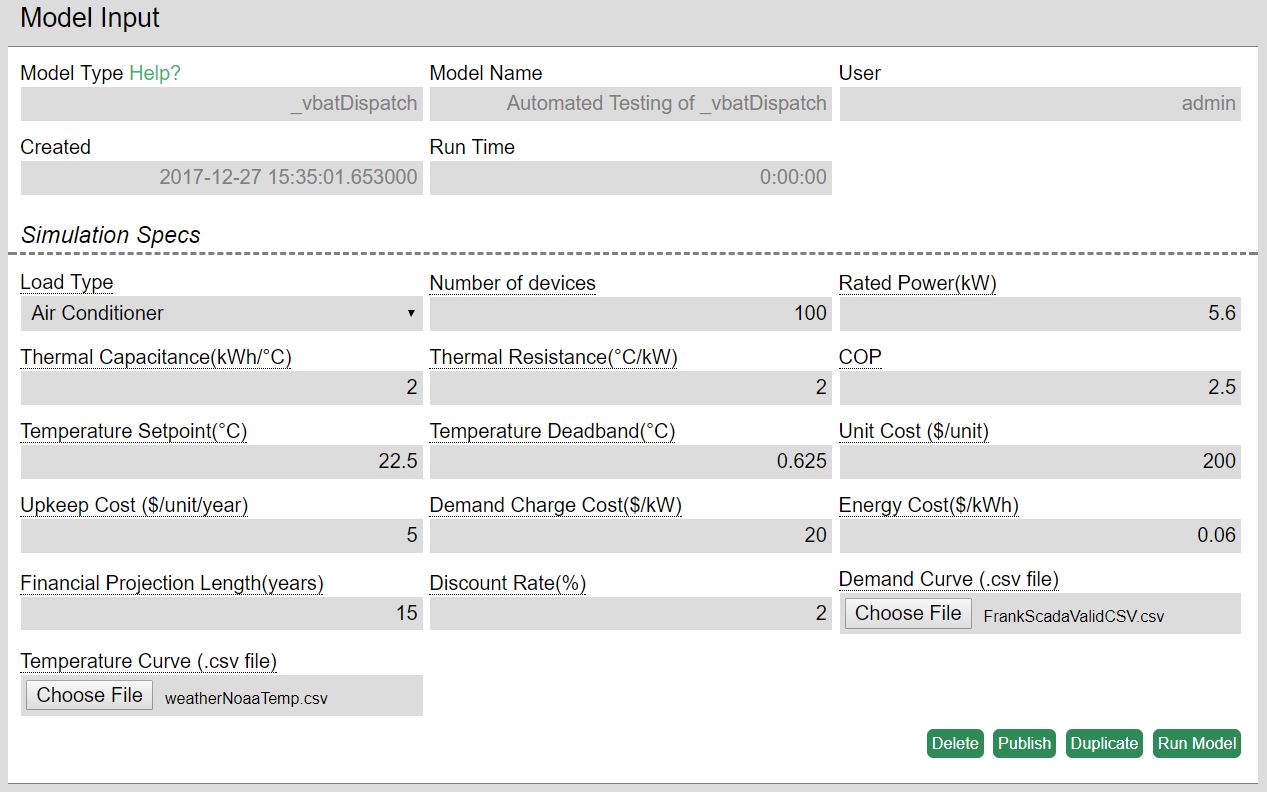
This file is a .csv file with 8760 hourly demand values in kW in a single column. Do not add a column title.
An example of a valid .csv:
1981
1903
1917
...
2436
2280
This file is a .csv file with 8760 hourly temperature measurements in Celsius in a single column. Do not add a column title.
An example of a valid .csv:
12.8
13.2
14.3
...
19.5
20.1
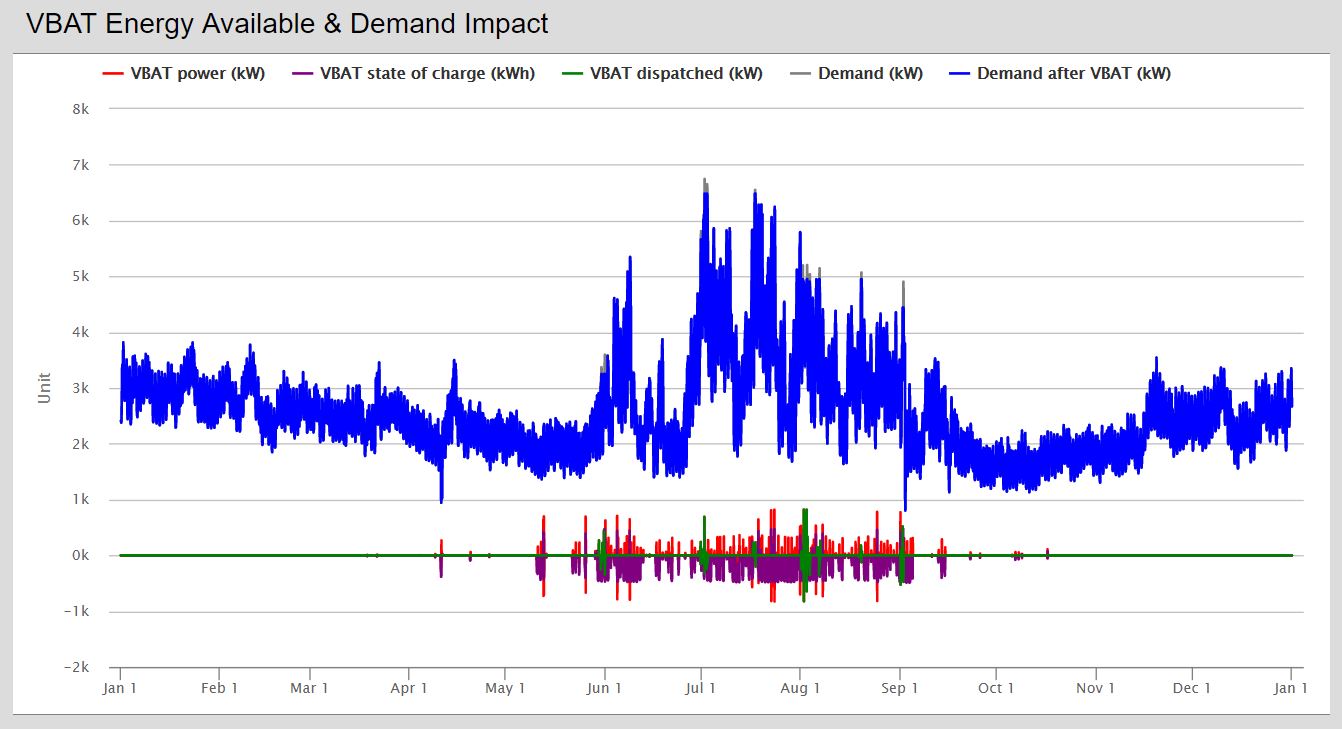
VBAT Energy Available & Demand Impact - Shows an hourly breakdown of how much power(red), charge(purple), dispatched power(green), demand(grey), and demand with vbat dispatched(blue). Any area of the plot can be selected to zoom in. The zoom is reset by a button that appears on the upper right corner. By default dispatched power is toggled off. Any series can be toggled on/off by single clicking it's name.
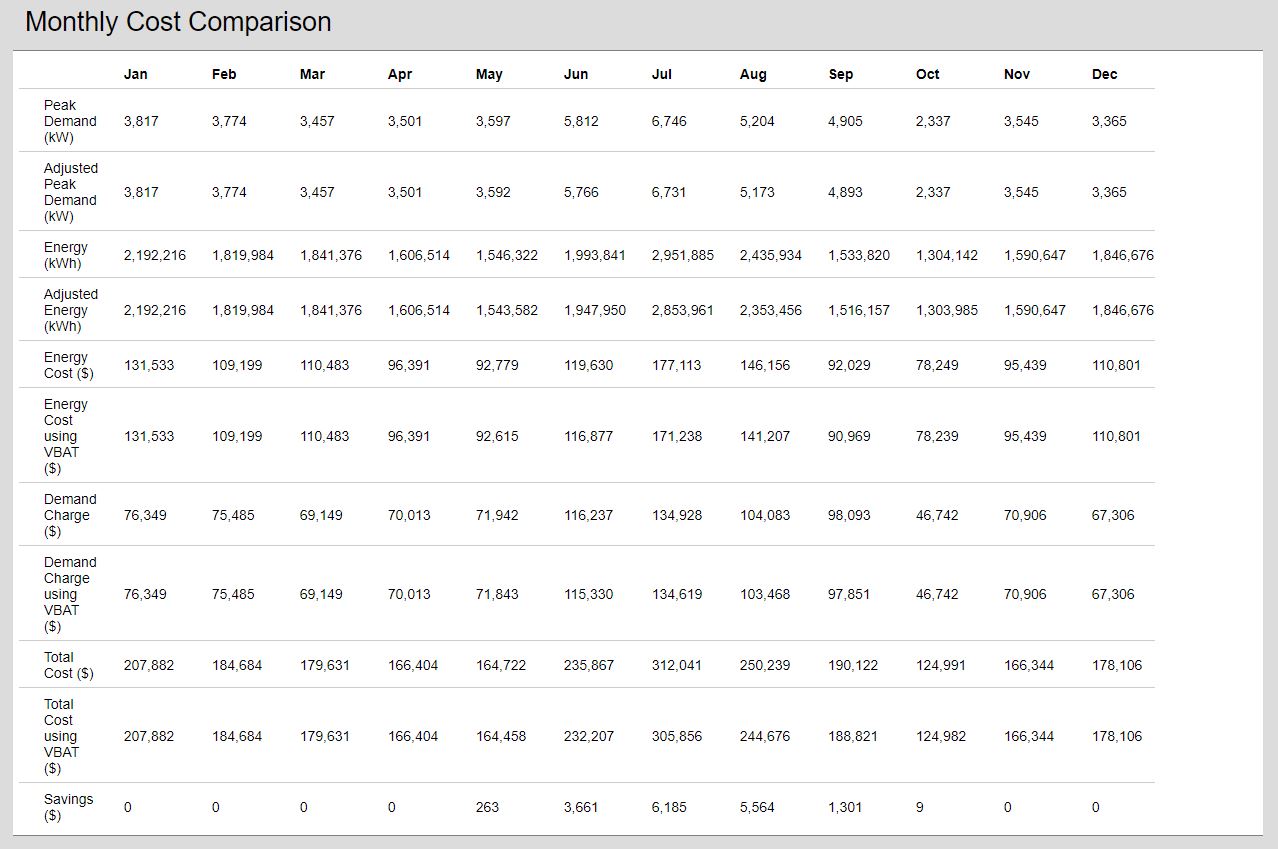
Monthly Cost Comparison - Shows a table of the monthly breakdown of the demand, energy, energy cost, demand charge, and total cost without and with VBAT. The last row is the savings generated from VBAT.
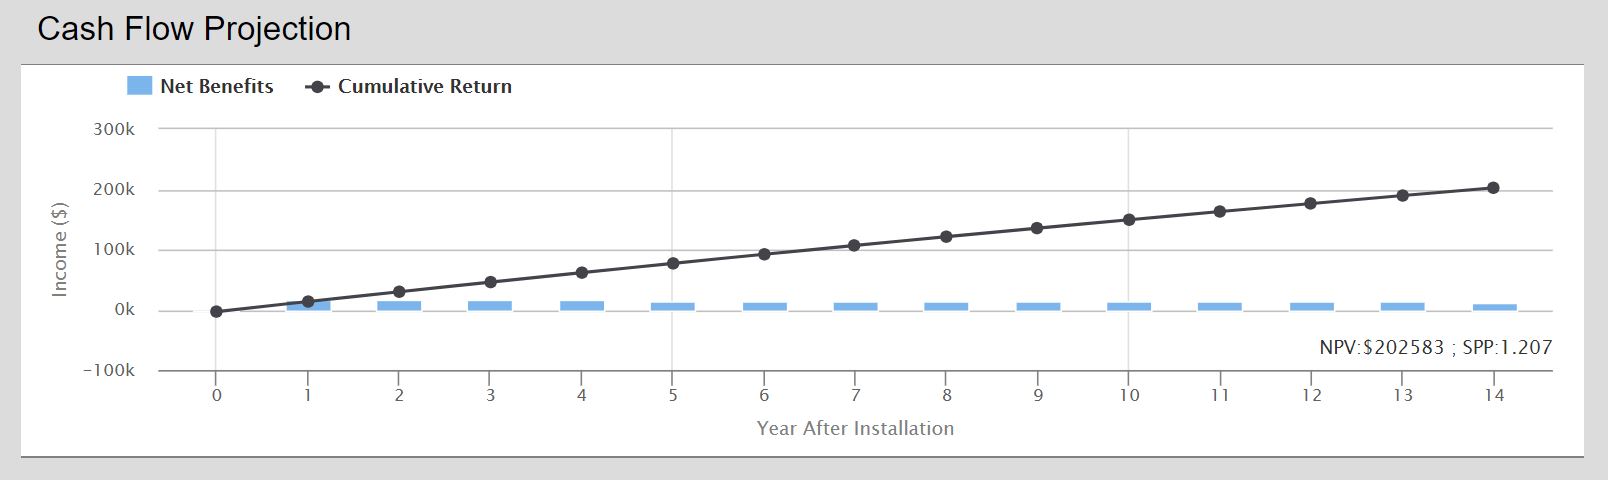
Cash Flow Projection - Shows a graph that looks at the yearly cash flows (in blue) over the user specified duration, and the cumulation of cash flows (in black). The lower right corner displays the Net Present Value (NPV) and Simple Payback Period (SPP).