A startup called Sparkify wanted to analyze the data they've been collecting on songs and user activity on their new music streaming app. The analytics team was particularly interested in understanding what songs users are listening to. Currently, they don't have an easy way to query their data, which resides in a directory of JSON logs on user activity on the app, as well as a directory with JSON metadata on the songs in their app.
They'd like a data engineer to create a Postgres database with tables designed to optimize queries on song play analysis, and bring you on the project.
Goals for the projects are to:
-
create a database schema
-
create an ETL pipeline for this analysis
-
test the created database and ETL pipeline by running queries given to me by the analytics team from Sparkify and compare my results with their expected results.
Database schema that was utilized in this project is one of the simplest data mart schemas named Star Schema which consist in our case of one fact table - songplays and several dimension tables - artists, users, songs and time from which two are the most relevant - artists and songs since it was utilized for the ETL and desired queries.
It was optimized for queries on song play analysis.
See below the tables fact and dimension tables.

ETL pipeline was designed with a main focus on getting the insights into understanding what songs users are listening to.
The whole ETL pipeline reads the json data from song_data and log_data files located in two local directories , processes it and inserts them into the Postgres database sparkifydb in created tables using Python and SQL. Tables where the data is inserted in the database are songplays, users, artists, songs and time. Time table has no defined relationship with the existing tables.
In addition to the data files, the project workspace includes six files:
test.ipynbdisplays the first few rows of each table to let you check your database. - it was used for testing of the developmentcreate_tables.pydrops and creates your tables. You run this file to reset your tables before each time you run your ETL scripts.etl.ipynbreads and processes a single file fromsong_dataandlog_dataand loads the data into your tables. This notebook contains detailed instructions on the ETL process for each of the tables. - it was used for developmentetl.pyreads and processes files fromsong_dataandlog_dataand loads them into your tables. You can fill this out based on your work in the ETL notebook.sql_queries.pycontains all sql queries, and is imported into the last three files above.README.mdprovides summary and discussion on the project.database_schema_diagram.pngis an image of a database schema diagram.
Below are steps you can follow to complete the project:
- Run
create_tables.pyto create the database and tables.
Run etl.py, where process the entire datasets. Remember to run create_tables.py before running etl.py to reset your tables.
The first dataset is a subset of real data from the Million Song Dataset. Each file is in JSON format and contains metadata about a song and the artist of that song. The files are partitioned by the first three letters of each song's track ID. For example, here are filepaths to two files in this dataset.
song_data/A/B/C/TRABCEI128F424C983.json
song_data/A/A/B/TRAABJL12903CDCF1A.json
And below is an example of what a single song file, TRAABJL12903CDCF1A.json, looks like.
{"num_songs": 1, "artist_id": "ARJIE2Y1187B994AB7", "artist_latitude": null, "artist_longitude": null, "artist_location": "", "artist_name": "Line Renaud", "song_id": "SOUPIRU12A6D4FA1E1", "title": "Der Kleine Dompfaff", "duration": 152.92036, "year": 0}The second dataset consists of log files in JSON format generated by this event simulator based on the songs in the dataset above. These simulate app activity logs from a music streaming app based on specified configurations.
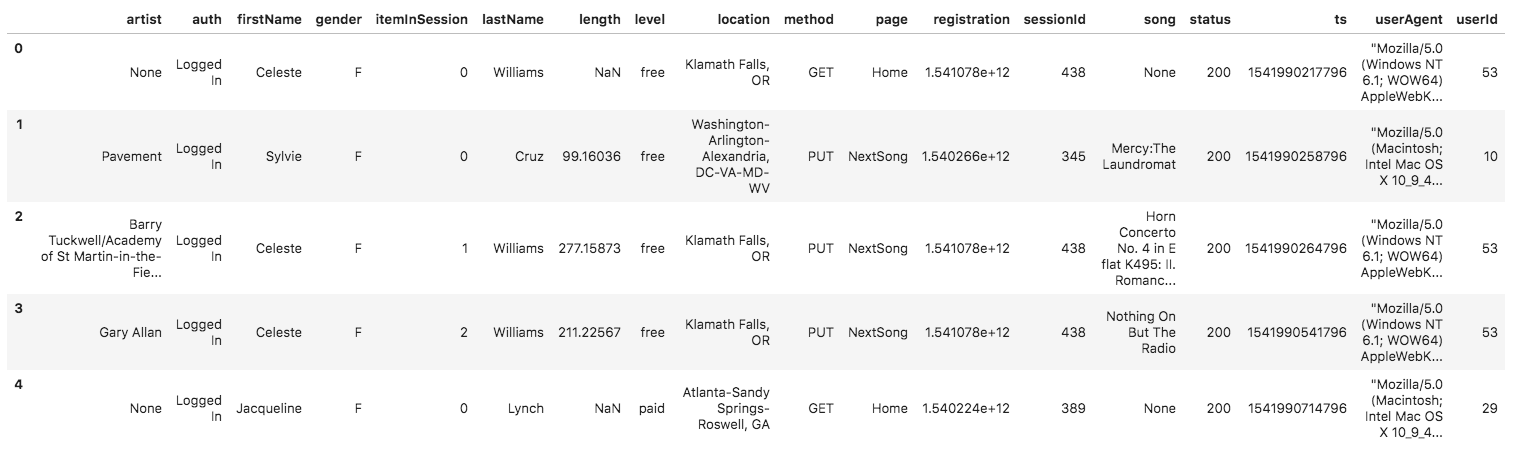
The log files in the dataset you'll be working with are partitioned by year and month. For example, here are filepaths to two files in this dataset.
log_data/2018/11/2018-11-12-events.json
log_data/2018/11/2018-11-13-events.json
And below is an example of what the data in a log file, 2018-11-12-events.json, looks like.