Lines on Patch-Objects after *.EPS/PDF export - e.g. with contourf #44
Comments
|
@phwi - export_fig uses Matlab's underlying print() function to export the data to EPS/PDF, and as far as I am aware these extra lines are due to an internal Matlab bug in print(), probably due to the new graphics engine (HG2) that was introduced in R2014b. To verify that this is indeed the problem in your specific case, try using Matlab's print() directly and check whether the lines appear in the output. If you ever find a workaround (possibly involving some print() input parameter), then please report it so that it could be integrated into export_fig. There is currently no known workaround for vector formats (EPS/PDF), but if you can live with bitmap output then consider using a PNG output format, or use my ScreenCapture utility which takes a bitmap screenshot in a totally different manner, without using Matlab's print() function. FYI, this export_fig utility is the same as the one you used in 2012 (with natural improvements/fixes) - Oliver Woodford transferred export_fig ownership to me in Jan 2015 for continued maintenance. |
|
Thanks for the response: It's a shame... HG2 improved many graphic related things. Anyway: When I use a cotourf-plot with export_fig in MATLAB 2014a I don't have those tiny annoying lines. I really need the vector output format... I didn't find out a combination with print(), that works for me... so no matter what I try, when trying to export to any vector format, I will always have those tiny lines. Why can't MATHWORKS just change it in a way that makes contourf-plots look like when exported with HG1? In fact, it is really about aliasing... e.g. when I look at my figures in adobe reader I don't see those lines. But now I have to find out an option in any program that I plan to use in my work flow, which displays things like adobe reader does... I think this is a poor solution, considering that everything was displayed properly in MATLAB R2014a without having to change any setting in any program. When I import the *.eps files to Corel, do some further editing and afterwards export it to a bitmap Image like *.png for a presentation, I have to turn off anti aliasing (with all negative side aspects) in order to get rid of the tiny white lines in the *.png (!), otherwise I have those lines in my bitmap-format after exporting... I think I'll have to open a ticket on MATHWORKS. Do you know if there are plans to fix the strange HG2 behaviour regarding those white lines? |
|
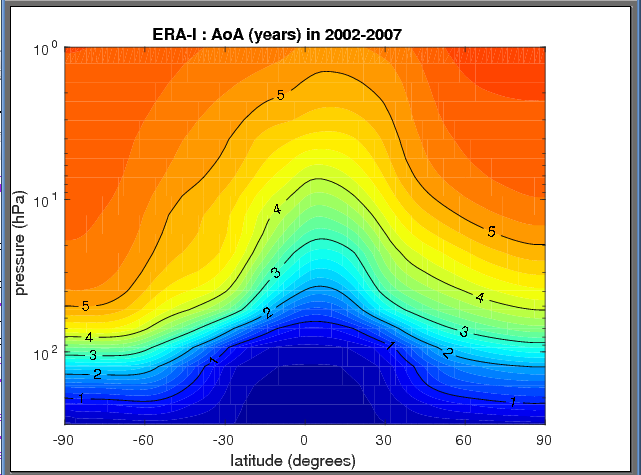
Is the thin white line from the bottom right to the top left corner in the below picture caused by the same problem as described above?
|

|
Hello jakobrdl, I am not sure if you observe the same problem that I observe: In you're case it looks more like a strange bug to me. The line in your picture goes straight through several different patch objects, while the lines in my picture are always between adjoining patch objects... |
|
@phwi - I discovered that these white line artifacts happen when the painters renderer is used (this was the underlying problem also with issue #39, since painters cannot render transparencies), and painters is the default rendering format for vectorized (EPS/PDF) formats. In contrast, PNG (and all other bitmap formats) uses -opengl rendering by default, which is probably the reason that the artifacts do not appear there. So, try to use the -opengl parameter with export_fig and see if it solves the problem for EPS/PDF. |
|
@altmany - I am sorry, somehow I did not point that out, yet: I know that using -opengl solves the problem. My PNG plots, etc. look fine. I am bothered about the fact not beeing able to export as a vector format without having bugs and artifacts, etc. - because I really need my exports to be a vector format, for more than one reason: 1.) Further and advanced editing and complex merging of different figures, which is not really possible in MATLAB. In fact I embed different figures for comparison in a more or less complex scetch of my measurement setup to point out how the differences in the setup manipulate the measurement data. So I use a third party program, in which i need the original graphics_data as vectors, because the all over quality etc. is far better for high publications, you can zoom into vector graphics endlessly..., the document size is very low compared to high resolution pixel graphics (in order not to see the pixels...).
|
|
@phwi - I can't answer for MathWorks. Hopefully they will fix these bugs someday... All I can do is to workaround the bugs by post-processing the generated EPS file. If you have insight into that and know your way around the Postscript code in the EPS file, then let me know what you discover and maybe I can include such a workaround in export_fig (many other internal Matlab bugs were fixed in this way in export_fig). Regarding transparency, the painters renderer does not support transparency. In this case it's a known and documented feature of Painters (not a bug). Only OpenGL supports transparency. So whenever you export using -painters you will see the result without transparent patches/annotations (even if they appear transparent in the Matlab figure, which uses OpenGL). |
|
@altmany - I have opened a Mathworks support ticket... maybe there is already a workaround to fix the EPS-files in a post-process, which I can then share here in order to get it included in export_fig like the bug with the linejoins, which messed up the graphs totally that I had been reporting some months ago. Thanks so far, I'll let you know about the answer of MATHWORKS. |
|
Mathworks information: Anyway, we can't derive if and when Mathworks will succeed in coming up with a solution to the issue described in the topic post. Let's hope that it won't take another two or three release versions, until they come up with a solution. So far I think that this topic can be closed except for someone objecting a solution altering the *.EPS-output in a post-process that makes those tiny white lines vanish without having to change anti-aliasing settings in the desired third party program or pdf-viewer... |
|
@phwi - I've traced the problem down to the fact that Matlab's print() function exports patches as a combination of filled triangles, and a white line appears where the triangles touch. I uploaded a workaround that converts such dual-triangles into a single filled rectangle. I was careful to only modify regexps that exactly match specific triangle patterns - it's better to not correct some white-line artifacts than to change the geometry of a patch, or to corrupt the EPS. Anyway, please let me know if this appears to solve part or all of the problems. Also please let MathWorks know about this so that they could tell the developers assigned to this bug of my findings and workaround. |
|
@altmany I tried to check the new print2eps.m file and compare it to the old one by using the following code in MATLAB R2015a: [X,Y,Z] = peaks(100);
[~,ch] = contourf(X,Y,Z);
ch.LineStyle = 'none';
ch.LevelStep = ch.LevelStep/10;
colormap('hot')
export_fig('Abbildung_original','-eps', '-transparent', '-q101', '-RGB');and then changed the print2eps.m content to the old content without the fix and used: This is what I got (see attachment): so in this case I don't see any change at all. Do I have to exchange more than the print2eps.m file in order to make the fix work? Or does the fix only work for certain artifacts, which somehow don't occur in the example I've been choosing? Somehow it seems as if in my example are no triangles at all when exporting to *.eps --> in the test case it doesn't matter if I use the fix or not. --> maybe I'll have to try it for some other cases. |

|
There is no need to go as far as peaks(100) - the problem appears quite vividly in peaks(3) for example: Or an even simpler test example: [~,ch]=contourf(magic(2));
set(ch,'LineStyle','none');
set(gca,'Visible','off');
colormap hot;
export_fig test.eps; winopen test.eps
print(gcf,'-depsc2','test.eps'); winopen test.eps % prove that the artifacts come from print()So it seems that there may be several possibly-unrelated problems with the
The search continues... |

|
@altmany Ok I See, thanks for the separation of the three sources of issues and which of them is solved by your fix. Now I know that the issue that (actually) bothers me most is the third point. The hor/vert lines are ugly but not that bad because of a sort of regularity. And thanks for fixing one of the issues --> It should fix the problem of @jakobrdl I suppose. |
|
In Adobe I hope this helps for some of you. Annoying issue. |
|
Hey @enigmaldc - I forgot to mention it here but Mathworks gave me exactly the same hint, which CAN be indeed useful but does not guarantee to solve the problem (maybe a 90 % solution). Anyway, it seems like such a poor workaround to me and a totally unsatisfactory solution by Mathworks. PDF was created for interoperability and operating system independence in a broader sense. It is a pain in the *** telling someone "[...] see my paper attached but before you can read it, you'll have to find out how to manipulate anti-aliasing and some other graphic settings in your desired *pdf-viewer [...]". On tablets and smartphones (yes, sometimes I read papers there indeed) there is no such thing as settings to change anti-aliasing behaviour but the graphics display get's messed up in the same way... Thanks anyway for the crossreference and the suggested solution (that works most often but not always(!)). |
|
Hello, I have similar issues exporting figures generated using 'surf' or 'patch' and exporting as PDF. I have been using a previous version of export_fig (not sure where to find the version number, but the copyright only has "Oliver J Woodford" listed). I noticed that with the current version, even if I specify "pdf" as output, I get a figure that appears to be tiled bitmaps. In addition, you can see the lines where the tiles do not exactly touch. I can delete these tiles separately in Inkscape. I've attached an image that I converted from PDF to PNG using GIMP. Also, I now have to specify 'nocrop', otherwise the image is cut off at both ends. In the previous version, I never had to specify 'nocrop' to get the full image. Is this intended behavior?
To get the original behavior of full vectorized output (albeit with annoying triangles), I have to specify 'painters'. Is this the intended behavior? It seems strange to specify PDF and get a bitmapped output. Currently, it seems like the default behavior for the previous version makes more sense (a vectorized output for pdfs and no image cropping), so I will continue using the older version for now. Thank you! |

|
I have this bug as well after updating to 2015b - if I knew about it I would have stayed with R2012b :( |
|
The responses from MathWorks are infuriating, they have introduced a method that creates much bigger vector files that are, in addition, unusable for publication / sharing. Yet they refuse to acknowledge the problem and offer the "solution" of meddling with the settings of the reader app. Is there any way of at least starting post-R2012b MATLAB with the original graphics engine to properly export these kind of vector figures? Because the newer versions are totally unusable:
|

|
@JorgeGT - there is no way (at least none that I'm aware of) to use the old graphics engine in R2014b or newer Matlab releases. |
|
@altmany Thanks, I guess I will have to go to the IT guys to see if they have installers for older versions! Thanks for your quick response and for the effort you're putting in |
|
Hey all. I also ran into this bug, and when searching for the solution found this post. Since no one seems to have a solution, I tried to fix it myself, and managed to create a script that at least works for me. It fixes all artefacts in any PDF viewer that I tried, and also makes the EPS files a lot smaller. I hope it also helps some of you! |
|
@Sbte - if you could convert your Python script into Matlab code (which should not be too difficult), then I could integrate it into |
|
You'd still need to use system() to call Inkscape, is that a problem? If not then I can see what I can do. I just wrote it in Python, because parsing files/text is much easier in Python than in Matlab... Also, did you test it yourself? As I stated in my README, so far I only checked it on my system. Any feedback would be welcome. |
|
@Sbte Can confirm it works for me, awesome work! I used: print(gcf,'temp','-depsc2')
system('python fix_matlab_eps.py temp.eps temp2.eps');
eps2pdf('temp2.eps',[fileName '.pdf'],1)
delete temp.eps temp2.epsAnd the result was: The only issue I had was that the right colorbar has a small diagonal line remaining.But I'm looking to style the colorbar better so it's not a problem for me! |

|
Ok, Mathworks have released the Matlab 2017b. Does anyone have a chance to test if this issue got fixed from MathWorks? Thanks! |
|
Hey, so I just tried plotting some contours with the freshly installed 2017b and using I also tried using the minimal example contourf(peaks(100));saveas(gcf,'figure.eps','epsc')and got the following (using preview in OSX High Sierra to open the .eps and then exporting it to .pdf before uploading it here): figure.pdf |
|
I just installed Matlab 2017b and made some trials. It doesn't seem to fix the problem for me. Code: contourf(peaks(100));export_fig('figure1','-eps','-pdf','-painters');
contourf(peaks(100));export_fig('figure2','-eps','-pdf','-opengl');Files: Screenshot: Recap on the issues:
My OpenGL version info: @briochemc You said you export the eps to pdf using some preview software. What is the name of the preview software? I can try again if I have the software on my computer. Thanks. |

|
figures.zip |
|
Sadly I can confirm that with Distiller the results are the same as yours, bug still present.... |
|
Whooooops! I made a mistake, I was actually using 2017a instead of 2017b on Windows 10. So far, the only issue to me is the lines are actually segments with sharp edges. See the attached eps files. PDFs are also available generated from |
|
I just tried a few other plots, as confirmed from the 2017b prerelease, a few other issues don't seem to have been fixed to this end. For example, figure(1); pcolor(peaks(100)); shading interp;
saveas(gcf,'figure3','epsc')
epsclean('figure3.eps','figure3_clean.eps','CombineAreas',true,'RemoveBoxes',true)
export_fig('figure4','-eps','-pdf','-painters')
export_fig('figure5','-eps','-pdf','-opengl')
epsclean('figure5.eps','figure5_clean.eps','CombineAreas',true,'RemoveBoxes',true)generate the following plots (only pdf allowed on github): Similarly, for |
|
I was excited thinking that 2017b would fix the issue, but alas, I still have the white line etching in many of my eps files. The best workaround I've found to get a smaller vector file without the white line etching is to follow Elmar Plischke's post from 11 Aug 2016 on this matlab thread and then follow it up in Illustrator (though Preview/other viewers should be fine too) following e-create's response on this thread. My workflow:
I wish matlab would just correct this...too many steps to make a figure look like it does when it's on your screen in matlab. Yes, matlab is correct that you can make it look better in each pdf viewer by playing around with preferences. But, I want to know that a figure is going to look how I intended it to - no matter who is opening it and with what software and settings and preferences. It shouldn't be on individual people to modify their pdf viewer settings individually to correctly display our figures because of how matlab renders them when using print. |
|
@ambramson, thanks for this, very useful. Your advice fixes the issues I was having. This little code does step 2 in one go: #/bin/bash
line=$(sed -n '/\/f\/fill/'= $1)
linenew=$(sed -n '\/LW\/setlinewidth ld/'= $1)
if [ -z "$line" ]; then
echo "File already fixed or not created by print command"
else
echo "File fixed!"
sed -i -e 's/\/f\/fill ld/\/f{GS 1 LW S GR fill}bd/' $1
printf "$line m$linenew\nw\n" | ed $1
fisave say to 'epsfix.sh', make executable, and run as epsfix.sh yourepsfile.eps As export_fig does not seem to produce the same EPS commands, it sounds like there's no way to produce 'fixable' eps files with export_fig for now, correct? |
|
Thanks for everyone for contributing workarounds to the many iterations of buggy matlab. I do hope this issue is fixed by mathworks in the next release, as it's approaching 3 years! I'm not going to hold my breath on this one |
|
The matlab function epsclean provided by @Conclusio above looks like a viable workaround. It works well when used alone, but it seems incompatible with export_fig in my case 👎 |


|
Looks like this is still a problem with matlab 2018a.... sigh |
|
@musm I haven't tried 2018a but for my 2017b solved this. |
|
@musm Can you share script that didn't work for you? |
|
Please see my post on this thread, dated 14 Apr 2018: Conclusio/matlab-epsclean#9 |
|
See related MathWorks official bug report, which lists this bug as being "solved in R2017b" (which of course it is still not): https://www.mathworks.com/support/bugreports/1174438:
|
It is almost funny, because it is almost true |
|
Hi, Best regards |
|
Hi, |
Can you share script or code that is producing white lines, I have multiple contour plots & they seems to work fine, I can probably look into it if you can share your sample code |
|
Thanks for the quick answer! |
Yes, 3d surfaces can still have a problem, one solution that I found was to turn axes invisible first & then print surface only. Afterward, turn surface invisible and print axes only & then merge them manually using illustrator or any other vector editors. try that & Let me know if that help |
|
Thanks so much, works perfectly! |
|
Great!, Just for future reference, if anyone is printing charts that are 3d, then they need to print all objects separately and then use an external tool to merge them, for e.g. if you had a surface, line, and axes then you will need to print them separately and then merge them manually. |
|
I recommend a much easier option, useing %EPS
exportgraphics(gcf,'myVectorFile.eps','BackgroundColor','none','ContentType','vector')
%PDF
exportgraphics(gcf,'myVectorFile.pdf','BackgroundColor','none','ContentType','vector')an example: clear
close all
warning('off','MATLAB:print:ContentTypeImageSuggested')%turn off Warning (Vector is not slower than Raster)
gcf=figure(314159265);
sphere %plot3(X,Y,Z) %Plot your awesome plot
daspect([1 1 1])%enssure that it is not distorted
%% Uggly RasterOutput
disp('Rasterouptut')
print('-depsc','-tiff','-r300','UgglyRaster.eps')%uggly: Rastergraphics
print('-dpdf','UgglyRaster.pdf')%uggly: Rastergraphics
%% Vector Output1 (no border for PDF, and optional transparent background)
disp('exportgraphics')%for R2020a or newer https://de.mathworks.com/help/matlab/ref/exportgraphics.html
exportgraphics(gcf,'myVectorFile1.eps','BackgroundColor','none','ContentType','vector')
exportgraphics(gcf,'myVectorFile1.pdf','BackgroundColor','none','ContentType','vector')
%% Vector Output2
disp('-vector')%In R2022a -painters got replaced by -vector
print('-depsc','-tiff','-r300', '-painters','myVectorFile2.eps')%large filesize
print('-dpdf','-r300', '-painters','myVectorFile2.pdf')%uggly: has large white borders
%% Vector Ouptut3
disp('Painters') %https://www.mathworks.com/matlabcentral/answers/92521-why-does-matlab-not-export-eps-files-properly
set(gcf,'renderer','Painters')
print('-depsc','myVectorFile3.eps')%white background which is exeedes the eps-border, not transparent
print('-dpdf','myVectorFile3.pdf')%uggly: has large white borders
|
It works! “exportgraphics” was released in 2020a. I thought it was a small bug, but it takes 6 years to fix... |
I know that there are plenty of comments on strange lines appearing in exported matlab output, still I didn't really find out if there is already a solution to my specific problem.
About 3 years ago I exported a MATLAB contourf plot to *.eps with export_fig of ojwoodford. I guess it was MATLAB R2012a or b and the present version of export_fig those days. It worked perfectly and there were no strange atrifacts, whatsorever.
Yesterday I did the same with MATLAB R2014b and the current release of export_fig. Now I have strange artifacts when exporting to *.eps or *.pdf.
See the attached image (left: 3 years ago, right: yesterday - it's a different colormap and a different matrix of data, but this shouldn't be the problem...)

Unfortunately those white lines are really present --> When I import the *.eps e.g. to Corel Technical Designer and further edit the image to do some tweaks for my presentation, these lines remain visible. After doing some editing and exporting from Corel Technical Designer to *.png or *.eps - I have the lines in both output formats...
Is there any solution to this problem?
Is it a bug or a feature?
Why did it work 3 years ago and now it doesn't anymore?
Is it the same issue that was already reported (#28) and ojwoodford responded that it is a bug, which will be fixed in the next MATLAB release: #28 ?? --> Because I just updated to MATLAB R2015a and to the latest export_fig release. The problem got not fixed...
Thanks for your help!
PS: In between I believe it is actually the anti aliasing... in adobe reader I can set a property (2D graphics accelaration) --> if switched on: the lines disappear. If turned off --> the lines reappear. But in most of the other programs (including GS viewer) I didn't manage to get rid of those lines. Actually the lines obstruct further editing in some third party software outside of MATLAB... and I don't get why I did not have those lines when exporting three years ago... I checked my *.eps files from then: no lines at all in none of the figures I exported then (neither in GS viewer nor in third party software...) --> So why do those lines appear now??
The text was updated successfully, but these errors were encountered: