![]()

Open ports inventory for local servers. Exports data to InfluxDB2/Grafana
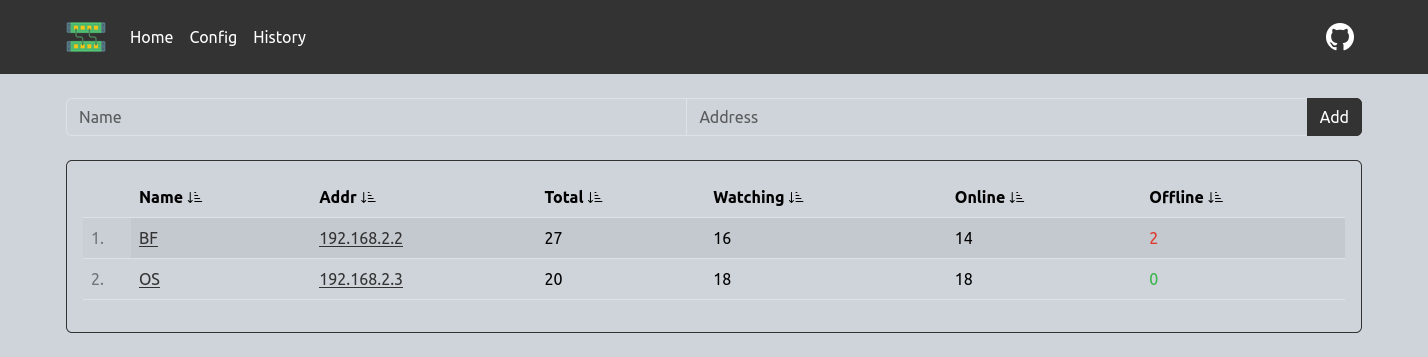
More screenshots


docker run --name wyp \
-e "TZ=Asia/Novosibirsk" \
-v ~/.dockerdata/WatchYourPorts:/data/WatchYourPorts \
-p 8853:8853 \
aceberg/watchyourports
Or use docker-compose.yml
- Run docker-export.sh on a server, where Docker is installed.
$ADDRis IP or domain name of the server, withouthttp(s)://prefix. It will be used to ping ports.
./docker-export.sh $ADDR- Paste the output to
hosts.yamlfile in WatchYourPorts config dir - You can add as many servers to
hosts.yaml, as you want
Configuration can be done through config.yaml file or GUI, or environment variables
| Variable | Description | Default |
|---|---|---|
| HOST | Listen address | 0.0.0.0 |
| PORT | Port for web GUI | 8853 |
| THEME | Any theme name from https://bootswatch.com in lowcase or additional | grass |
| COLOR | Background color: light or dark | dark |
| TIMEOUT | How often watched ports are scanned (minutes) | 10 |
| HIST_TRIM | How many port states are saved in memory and displayed | 90 |
| TZ | Set your timezone for correct time | "" |
This config matches Grafana's config for InfluxDB data source
| Variable | Description | Default | Example |
|---|---|---|---|
| INFLUX_ENABLE | Enable export to InfluxDB2 | false | true |
| INFLUX_SKIP_TLS | Skip TLS Verify | false | true |
| INFLUX_ADDR | Address:port of InfluxDB2 server | https://192.168.2.3:8086/ | |
| INFLUX_BUCKET | InfluxDB2 bucket | test | |
| INFLUX_ORG | InfluxDB2 org | home | |
| INFLUX_TOKEN | Secret token, generated by InfluxDB2 |
| Key | Description | Default |
|---|---|---|
| -d | Path to config dir | /data/WatchYourPorts |
| -n | Path to local JS and Themes (node-bootstrap) | "" |
By default, this app pulls themes, icons and fonts from the internet. But, in some cases, it may be useful to have an independent from global network setup. I created a separate image with all necessary modules and fonts.
docker run --name node-bootstrap       \
    -v ~/.dockerdata/icons:/app/icons  \ # For local images
    -p 8850:8850                       \
    aceberg/node-bootstrap
docker run --name wyp \
-v ~/.dockerdata/WatchYourPorts:/data/WatchYourPorts \
-p 8853:8853 \
aceberg/watchyourports -n "http://$YOUR_IP:8850"Or use docker-compose
GET /api/allReturns all data about saved addresses in json.
Response example
{
    "192.168.2.2": {
        "Name": "SomeAddrName",
        "Addr": "192.168.2.2",
        "PortMap": {},  // All saved ports will be here
        "Total": 0,
        "Watching": 0,
        "Online": 0,
        "Offline": 0
    },
}
GET /api/historyAll history data from memory.
Response example
{
"192.168.2.3:8849": {
        "Name": "OS",
        "Addr": "192.168.2.3",
        "Port": 8849,
        "PortName": "MiniBoard",
        "State": [
            {
                "Date": "2024-06-28 22:42:45",
                "State": true
            },
            {
                "Date": "2024-06-28 22:52:45",
                "State": true
            }
        ],
        "NowState": true
    },
}
GET /api/port/:addrReturns current PortMap for addr.
Request example
curl http://0.0.0.0:8853/api/port/192.168.2.2Response example
{
    "8850": {
        "Name": "node-bootstrap",
        "Port": 8850,
        "State": true,
        "Watch": true
    },
    "8851": {
        "Name": "Exercise Diary",
        "Port": 8851,
        "State": true,
        "Watch": true
    },

}
GET /api/port/:addr/:portGets state of one port
Request example
curl http://0.0.0.0:8853/api/port/192.168.2.2/8844Response example
{
    "Name": "git-syr",
    "Port": 8844,
    "State": true,
    "Watch": true
}- All go packages listed in dependencies
- Bootstrap
- Themes: Free themes for Bootstrap
- Favicon and logo: Flaticon