- Please click the Streamlit Link here to interact with the App.
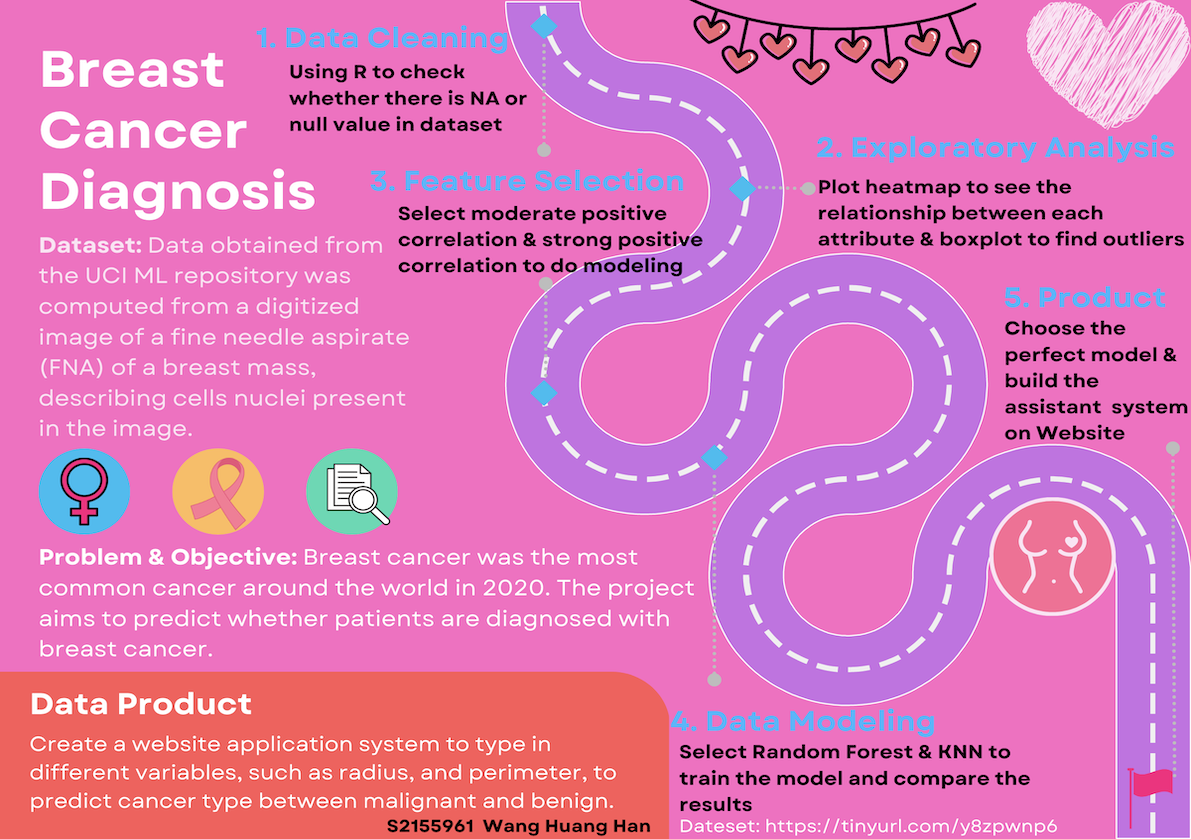
This project focuses on the classification of breast tumors as either Malignant or Benign using various machine-learning algorithms such as KNN, Logistic Regression, and Random Forest. Leveraging a dataset containing comprehensive tumor metrics such as radius, texture, perimeter, area, smoothness, and more, we aim to build robust models for accurate tumor classification.
The dataset comprises tumor characteristics such as radius, texture, perimeter, and other measurable features extracted from breast cancer images. These attributes serve as crucial inputs for training and testing the classification models.
Final project for the WQD7003 | Data Analytics course at the University of Malaya
Team members:
- Huang Han Wang
- Shuangdan Ni
- Xinrui Guo
- Ding Jie
- Naxin Dong
Instructor: Dr. Hema Subramaniam
- To perform preprocessing and exploratory analysis on the dataset.
- To build the classification model to judge whether the tumor type is malignant or benign.
- To compare the advantages and disadvantages of different classification algorithms based on evaluation metrics.
- To fine-tune and optimize the hyperparameters and improve the accuracy, stability, and execution speed of the tumor-type judgment model.
Streamlit Breast Cancer Detection App Explanation (Link)
Important Note: Please refer to this file breast_cancer_app.py.
The initial part involves importing the necessary libraries and modules required for the application. These include libraries for data manipulation (pandas, numpy), visualization (seaborn, matplotlib, plotly), machine learning models (sklearn), and the Streamlit framework (streamlit).
The main() function sets up the Streamlit app's layout, title, and initial configurations like page icon, title, and sidebar title.
-
load_data(): Loads the Breast Cancer dataset usingload_breast_cancer()fromsklearn, processes it into a DataFrame, and performs label encoding. -
split(df): Splits the dataset into training and testing sets usingtrain_test_split()fromsklearn.
This part handles the visualizations and displays for the data analysis section of the app. It includes:
- Displaying raw data and features
- Generating different types of plots based on user selection (scatter matrix, counts of malignant and benign cases, heatmap, scatter plots)
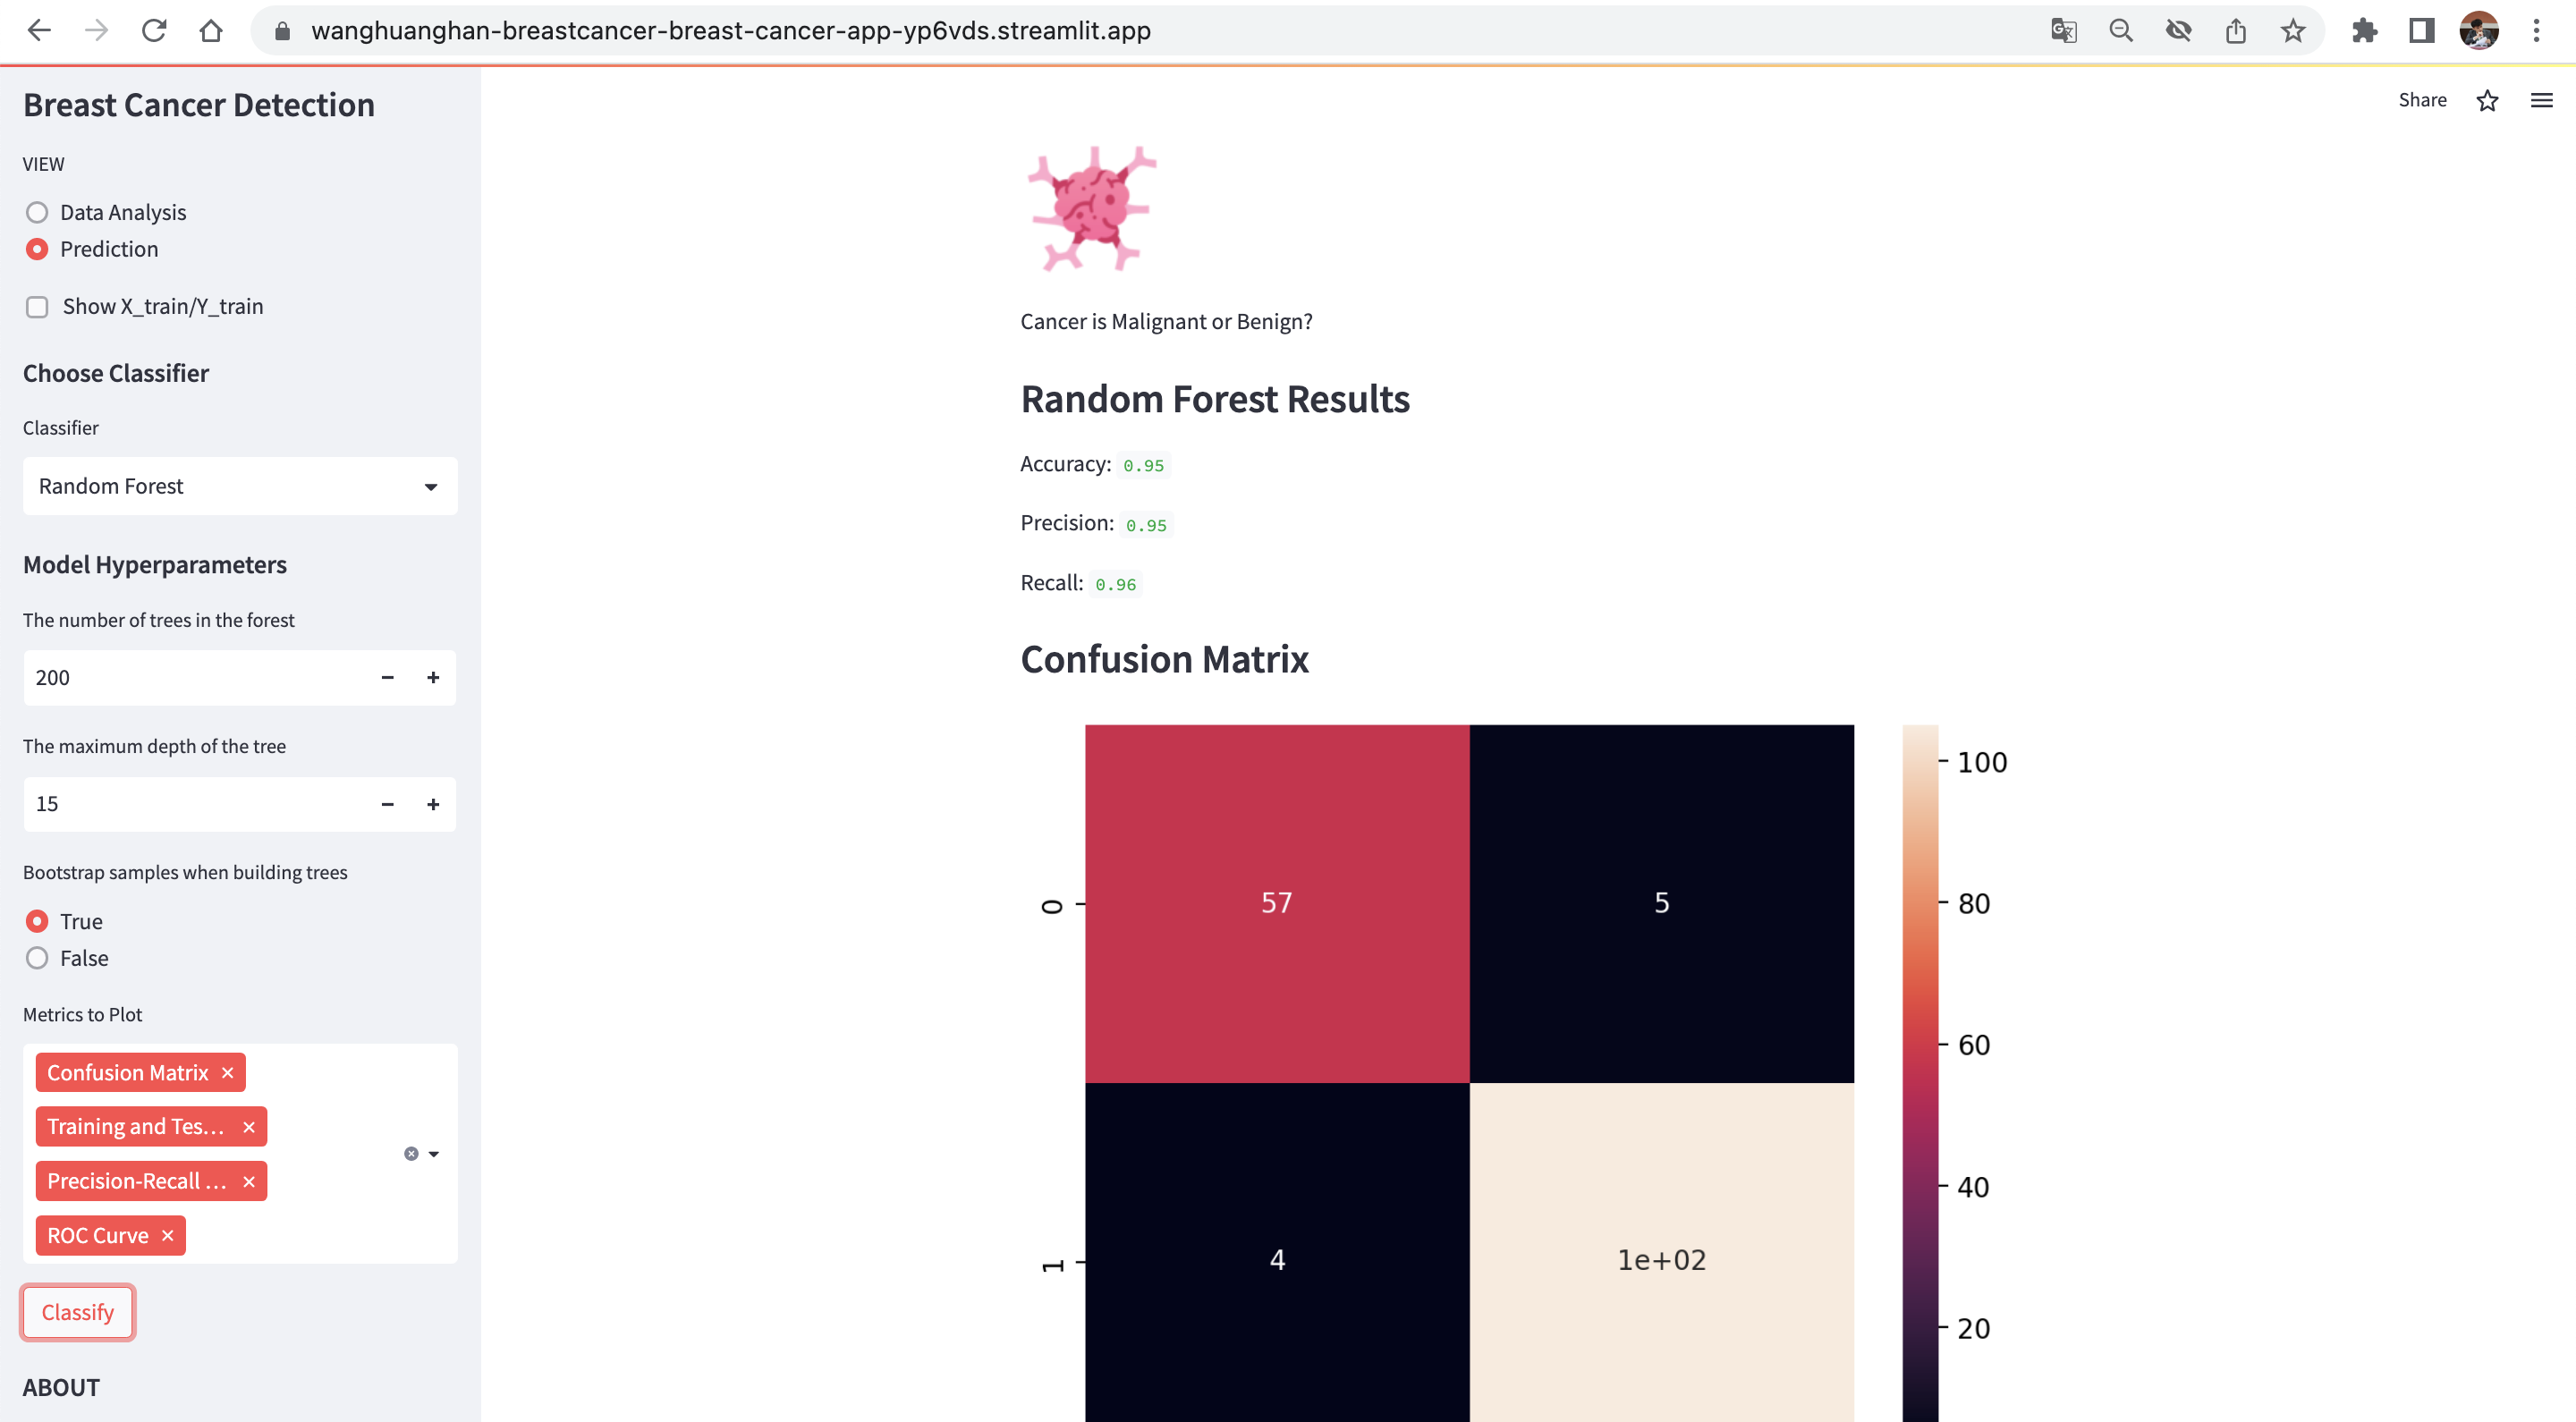
This section allows users to select different classifiers (Logistic Regression, Random Forest, KNN) and their hyperparameters, then displays metrics such as accuracy, precision, recall, and confusion matrices for the chosen classifier.
The workflow includes:
- Choosing a classifier from the sidebar
- Selecting hyperparameters for the chosen classifier
- Displaying classification results and metrics based on user selections
At the sidebar's bottom, information about the app creator and a reference to the app's GitHub repository are provided.