Virusparies is an R package designed for visualizing outputs from VirusHunterGatherer, a data-driven virus discovery (DDVD) tool. It provides a set of plotting functions that aid in the interpretation and analysis of viral sequence data. The name draws inspiration from the hunter-gatherer metaphor, with "paries" derived from Latin meaning "wall". It symbolizes the parietal art left by ancient hunters and gatherers on walls, summarizing their stories and beliefs.
VirusHunterGatherer is a computational pipeline designed for DDVD and is available on: https://github.com/lauberlab/VirusHunterGatherer. It involves two steps: (i) VirusHunter conducts sensitive homology-based detection of viral sequence reads in unprocessed data, identifying the most conserved regions of a virus, which serve as seeds for the (ii) Virusgatherer step that assembles full-length viral genome sequences.
Virus discovery, Viral discovery, virus scanning, R, R-Package,package, VirusHunter, VirusGatherer, VirusHunterGatherer, plots
You can choose to install the development version of Virusparies from GitHub:
### First install the "remotes" package

install.packages("remotes")

### Then install the Virusparies package

remotes::install_github("SergejRuff/Virusparies")
! Bioconductor version coming soon ...
Virusparies includes the following functions:
ImportVirusTable()Import VirusHunterGatherer Hittables into R.
VhgBoxplot()Boxplot plotting refSeq identity, e-values or contig length for each group.VhgIdenFacetedScatterPlot()Faceted scatter plot for reference identity vs -log10 of reference e-value.VhgIdentityScatterPlot()Scatter Plot for reference Identity vs -log10 of reference e-value.VhgRunsBarplot()Bar plot showing how many unique Runs map against each virus.
VhSumHitsBarplot()Bar plot for the sum of hits for each virus found in group.
VhgRunsTable()Generate a gt-table for VhRunsBarplot.VhgTabularRasa()Generate custome gt-tables.
The table functions generate gt objects, which can be further manipulated using the gt package (see the Details section for more information).
ExportVirusGt()Export graphical tables.ExportVirusPlot()Export plots.
The Virusparies package provides a set of plotting functions tailored for visualizing VirushunterGatherer hittables and generating graphical tables (gt) for the results generated by Virusparies or the user. It also contains functions for importing VirusHunterGatherer hittables and exporting both plots and graphical tables. Here, the functionality of each function will be explained in detail.
Each function takes a VirusHunterGatherer file (vh_file argument), a column that should be used for grouping on the x-axis (sometimes called x_column or groupby argument), a y_column argument and a cutoff for removing (or highlighting the amount of) observations below the user defined e-value threshold. The following points are important:
- Both x_column (or groupby) and y_column argument must be a string (character) specifying a column name in the VirusHunterGatherer Inputfile.
- Accepted x_column (or groupby) arguments are "best_query" (only for VirusHunter hittables) or "ViralRefSeq_taxonomy" (Default: "best_query").
- The cutoff is defined by the "ViralRefSeq_E" column.
- Default cutoff value is 1e⁻⁵, but the user is free to set their own cutoff value for e-values.
- cutoffs are used for filtering out observations above the defined threshold. Unless the thing being used for plotting is the "ViralRefSeq_E" column (see :Boxplot 1: "ViralRefSeq_E" or both scatterplots as an example). In those cases the unfiltered hittable is plotted and the cutoff is used to highlight the proportion of e-values above and below the threshold.
- Each Plot fills the elements of the plot and provides a legend. Filling and legend are based on the Phylum of each virus group (expect for the faceted Scatter plot, where each point is coloured based on whether the observation is above or below the threshold).
- Both the table and plot functions provide the user with arguments to customize the tables and plots to their liking.
Table functions return a gt object and each plot function returns a ggplot2 object for further plot manipulation. Besides the plot object some plots also generate and return summary statistics or filtered VirusHunterGatherer files for further downsteam analysis. The details section will point out, which object is generated by each function.
First, we load the package into R:
### load Virusparies into R

library(Virusparies)VirusHunterGatherer hittables are tab-separated values (TSV) files, which can be imported with the ImportVirusTable() function. Here, we will use the example VirusHunter and VirusGatherer hittable files included in the Virusparies package as an example:
### Import VirusHunter Hittable.

path <- system.file("extdata", "virushunter.tsv", package = "Virusparies")
vh_file <- ImportVirusTable(path)

print(head(vh_file))  # print head of hunter files

#>      SRA_run SRA_sample SRA_study   host_taxon host_taxid num_queries num_hits  best_E
#> 1 SRR10822543 SRS5937532 SRP239389 Homo_sapiens       9606           8       12 4.5e-05
#> 2 SRR12567985 SRS7305728 SRP279687 Homo_sapiens       9606           6        9 9.7e-13
#> 3 SRR12567985 SRS7305728 SRP279687 Homo_sapiens       9606           6        5 1.4e-08
#> 4 SRR10822560 SRS5937549 SRP239389 Homo_sapiens       9606          11        3 1.1e-08
#> 5 SRR12567985 SRS7305728 SRP279687 Homo_sapiens       9606           6        8 3.2e-10
#> 6 SRR10822546 SRS5937535 SRP239389 Homo_sapiens       9606           7       20 1.0e-01
#>       best_query ViralRefSeq_E ViralRefSeq_ident ViralRefSeq_aLen.sLen ViralRefSeq_contigs
#> 1 Anello_ORF1core      2.59e-38              93.8             192 / 194                   1
#> 2 Anello_ORF1core      8.44e-36              77.3             225 / 227                   6
#> 3 Anello_ORF1core      3.95e-34              70.1             231 / 232                   1
#> 4 Anello_ORF1core      3.69e-31              68.6             210 / 216                   1
#> 5 Anello_ORF1core      5.85e-31              76.9             195 / 201                   3
#> 6 Anello_ORF1core      8.63e-31              79.4             189 / 237                   1
#>                                                                               ViralRefSeq_subject
#> 1 gi:1464307144|Torque teno mini virus 11 isolate LIL-y2 ORF2, ORF1, and ORF3 genes, complete cds
#> 2                   gi:1464307216|Torque teno midi virus 11 DNA, complete genome, isolate: MDJN47
#> 3 gi:1464307144|Torque teno mini virus 11 isolate LIL-y2 ORF2, ORF1, and ORF3 genes, complete cds
#> 4                                          gi:134133206|Torque teno midi virus 1, complete genome
#> 5                   gi:1464307186|Torque teno midi virus 5 DNA, complete genome, isolate: MDJHem2
#> 6                   gi:1464307221|Torque teno midi virus 12 DNA, complete genome, isolate: MDJN51
#>                           ViralRefSeq_taxonomy date_analyzed
#> 1  taxid:2065037|Betatorquevirus|Anelloviridae    2022-05-17
#> 2 taxid:2065052|Gammatorquevirus|Anelloviridae    2022-05-06
#> 3  taxid:2065037|Betatorquevirus|Anelloviridae    2022-05-06
#> 4  taxid:687379|Gammatorquevirus|Anelloviridae    2022-05-17
#> 5 taxid:2065046|Gammatorquevirus|Anelloviridae    2022-05-06
#> 6 taxid:2065053|Gammatorquevirus|Anelloviridae    2022-05-17


### Import VirusGatherer Hittable.

path2 <- system.file("extdata", "virusgatherer.tsv", package = "Virusparies")
vg_file <- ImportVirusTable(path2)

print(head(vg_file))  # print head of gatherer files

#>       SRA_run SRA_sample SRA_study   host_taxon host_taxid                 contig_id
#>  1   ERR206007  ERS074208 ERP000373 Homo sapiens       9606   ERR206007_cap3_Contig-1
#>  2   ERR206007  ERS074208 ERP000373 Homo sapiens       9606   ERR206007_cap3_Contig-2
#>  3   ERR206007  ERS074208 ERP000373 Homo sapiens       9606   ERR206007_cap3_Contig-3
#>  4   ERR206007  ERS074208 ERP000373 Homo sapiens       9606   ERR206007_cap3_Contig-4
#>  5   ERR206021  ERS074222 ERP000373 Homo sapiens       9606   ERR206021_cap3_Contig-1
#>  6 SRR10822543 SRS5937532 SRP239389 Homo sapiens       9606 SRR10822543_cap3_Contig-1
#>    contig_len ViralRefSeq_E ViralRefSeq_ident ViralRefSeq_aLen
#>  1        603      4.22e-65            92.453              106
#>  2        461      3.22e-65            85.612              139
#>  3        364      2.46e-53            76.531               98
#>  4        334      9.87e-67            93.636              110
#>  5        323      8.91e-45            65.421              107
#>  6       3321      0.00e+00            86.058              789
#>                                                       ViralRefSeq_subject
#>  1                            acc:YP_009505712|Orf1 [Torque teno virus 5]
#>  2 acc:YP_003587853|hypothetical protein TTV10_gp4 [Torque teno virus 10]
#>  3                            acc:YP_003587868|ORF1 [Torque teno virus 3]
#>  4                           acc:YP_009505715|Orf1 [Torque teno virus 11]
#>  5        acc:YP_009505729|unnamed protein product [Torque teno virus 24]
#>  6                        acc:YP_009173866|polymerase [Hepatitis B virus]
#>                                                                                                ViralRefSeq_taxonomy
#>  1                                              taxid:687344|Alphatorquevirus homin5|Alphatorquevirus|Anelloviridae
#>  2                                             taxid:687349|Alphatorquevirus homin10|Alphatorquevirus|Anelloviridae
#>  3                                              taxid:687342|Alphatorquevirus homin3|Alphatorquevirus|Anelloviridae
#>  4                                                                      taxid:687350|Alphatorquevirus|Anelloviridae
#>  5                                             taxid:687363|Alphatorquevirus homin24|Alphatorquevirus|Anelloviridae
#>  6 taxid:10407|Orthohepadnavirus|Hepadnaviridae|Blubervirales|Revtraviricetes|Artverviricota|Pararnavirae|Riboviria
#>    date_analyzed
#>  1    2024-05-18
#>  2    2024-05-18
#>  3    2024-05-18
#>  4    2024-05-18
#>  5    2024-05-17
#>  6    2024-05-18
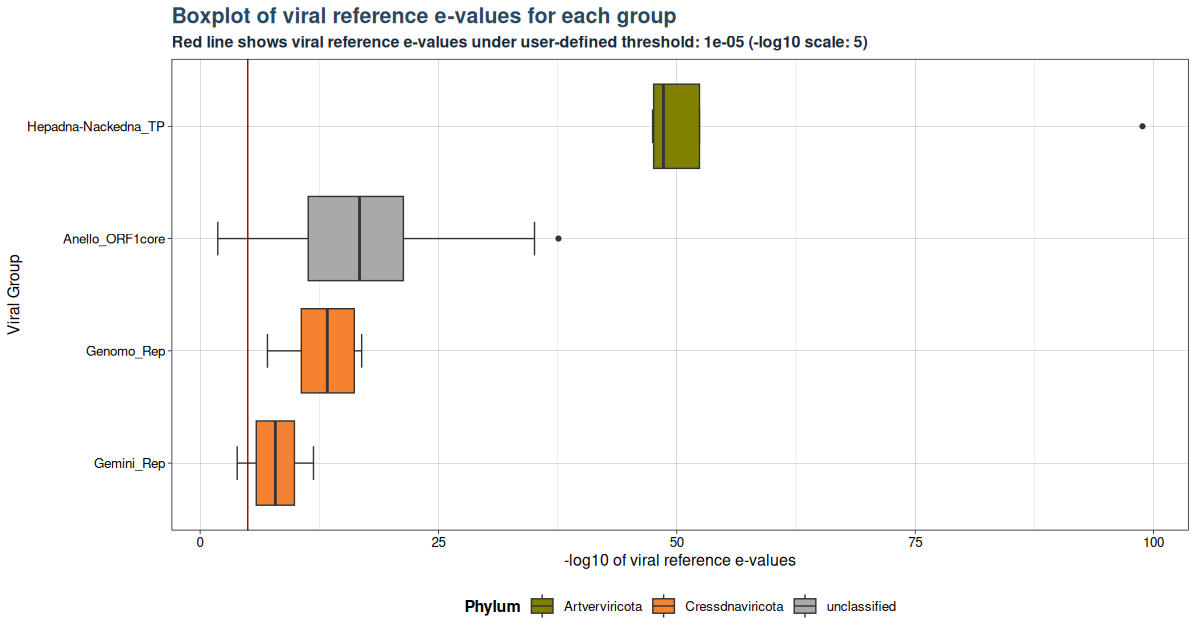
The VhgBoxplot() function generates 3 different versions of a boxplot depending on the provided y_column argument.
Accepted y_column are:
- "ViralRefSeq_E"
- "ViralRefSeq_ident"
- "contig_len" (Gatherer Tables only)
Below are 4 examples for different boxplots.
### Plot 1 for evalues
plot1 <- VhgBoxplot(vh_file, x_column = "best_query", y_column = "ViralRefSeq_E")
plot1
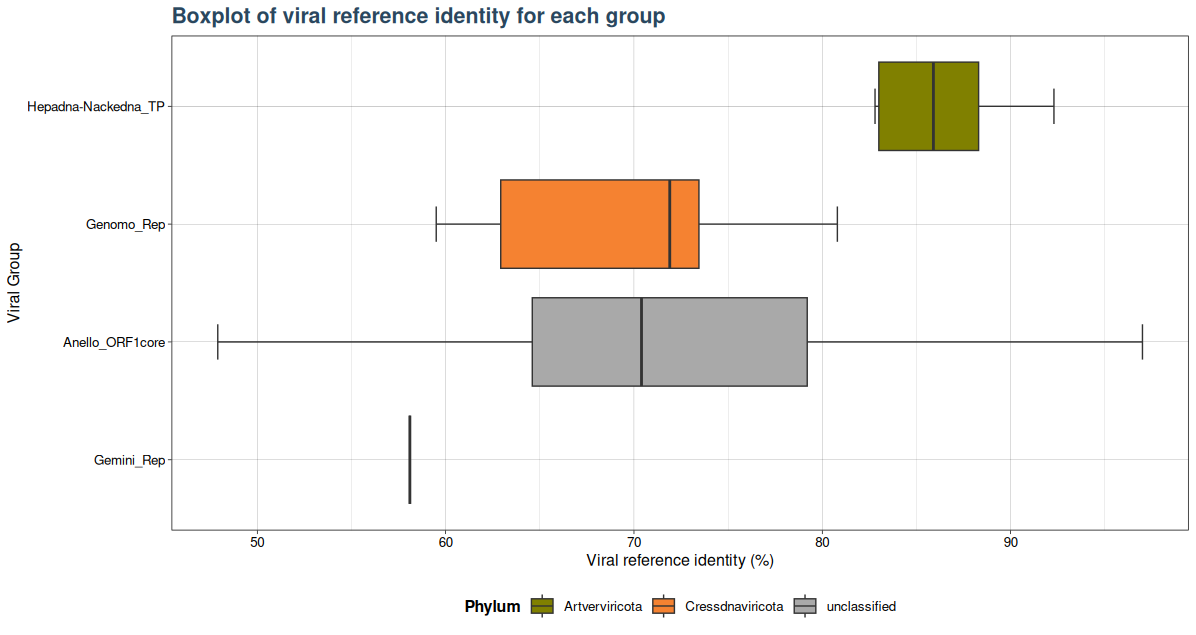
### Plot 2 for identity
plot2 <- VhgBoxplot(vh_file, x_column = "best_query", y_column = "ViralRefSeq_ident")
plot2
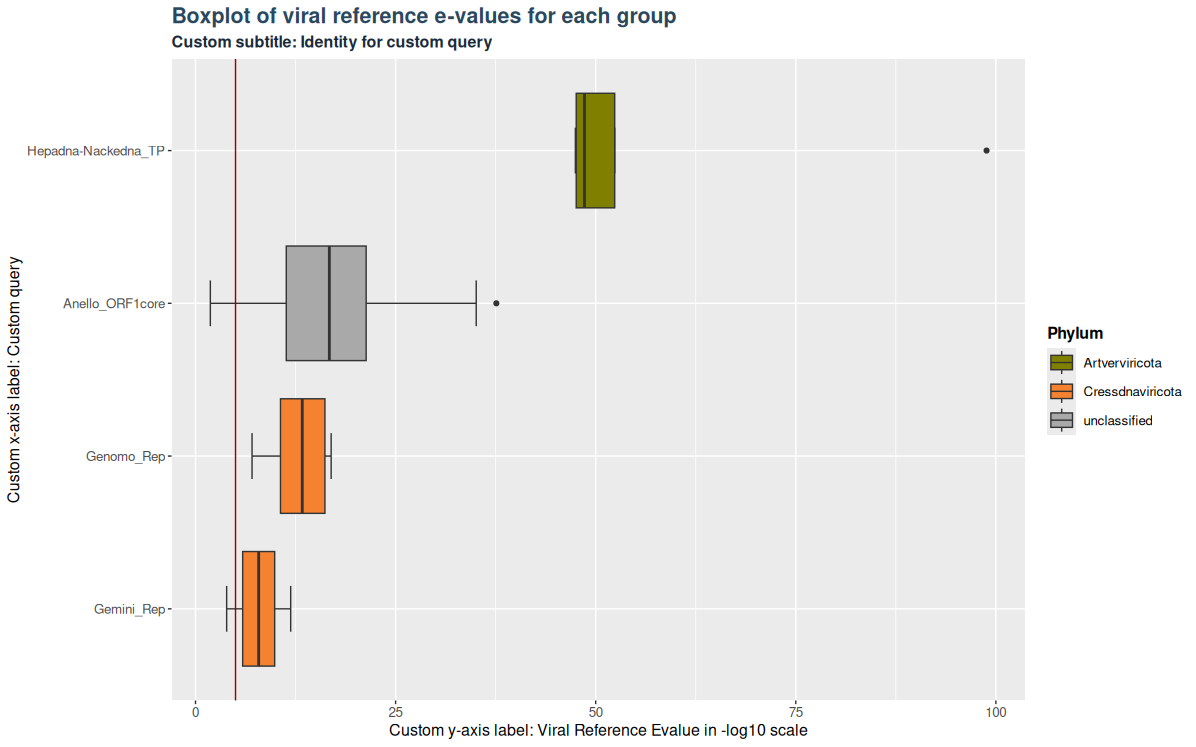
Plots and tables in Virusparies are highly customizable. This is true for all functions in Virusparies. Example 3 demonstrates it by changing the text of the subtitle and axis-labels, changing the position of the legend and changing the background theme.
### Plot 3 custom arguments used
plot3 <- VhgBoxplot(vh_file,
                   x_column = "best_query",
                   y_column = "ViralRefSeq_E",
                   theme_choice = "grey",
                   subtitle = "Custom subtitle: Identity for custom query",
                   xlabel = "Custom x-axis label: Custom query",
                   ylabel = "Custom y-axis label: Viral Reference Evalue in -log10 scale",
                   legend_position = "right")
plot3
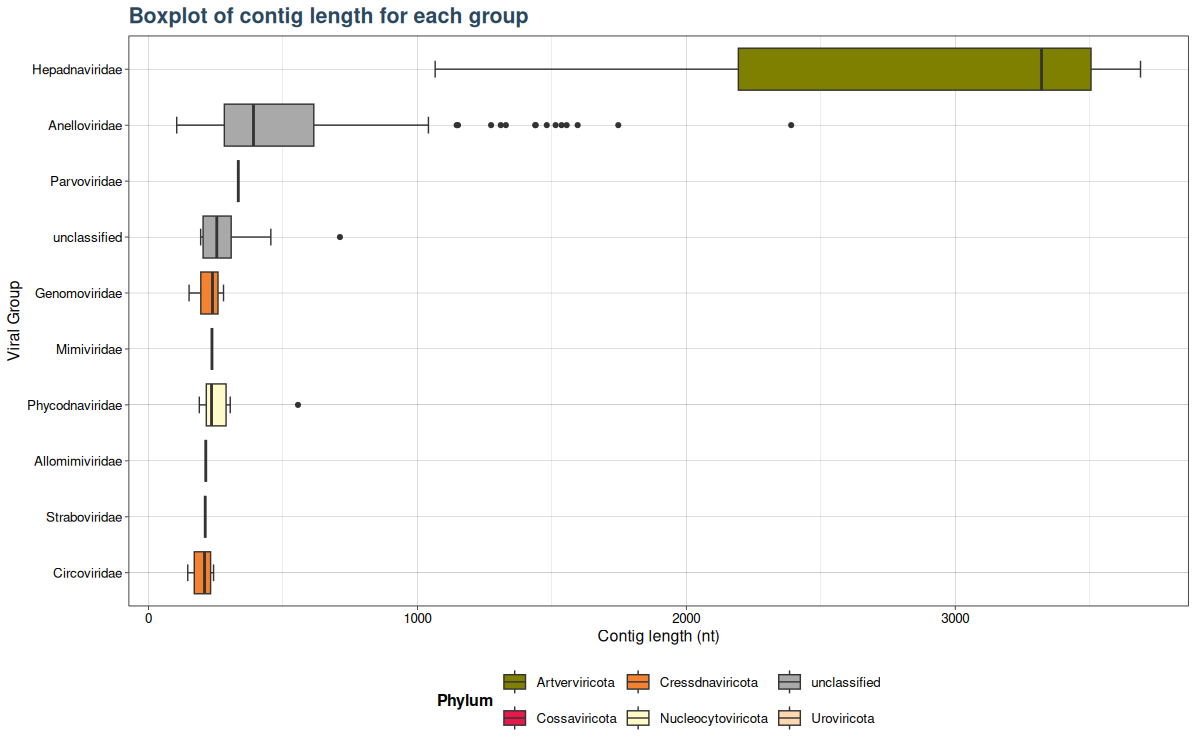
### Plot 5: Virusgatherer plot for SRA_runs agains contig length
plot4 <- VhgBoxplot(vg_file,x_column = "ViralRefSeq_taxonomy",y_column = "contig_len")
plot4
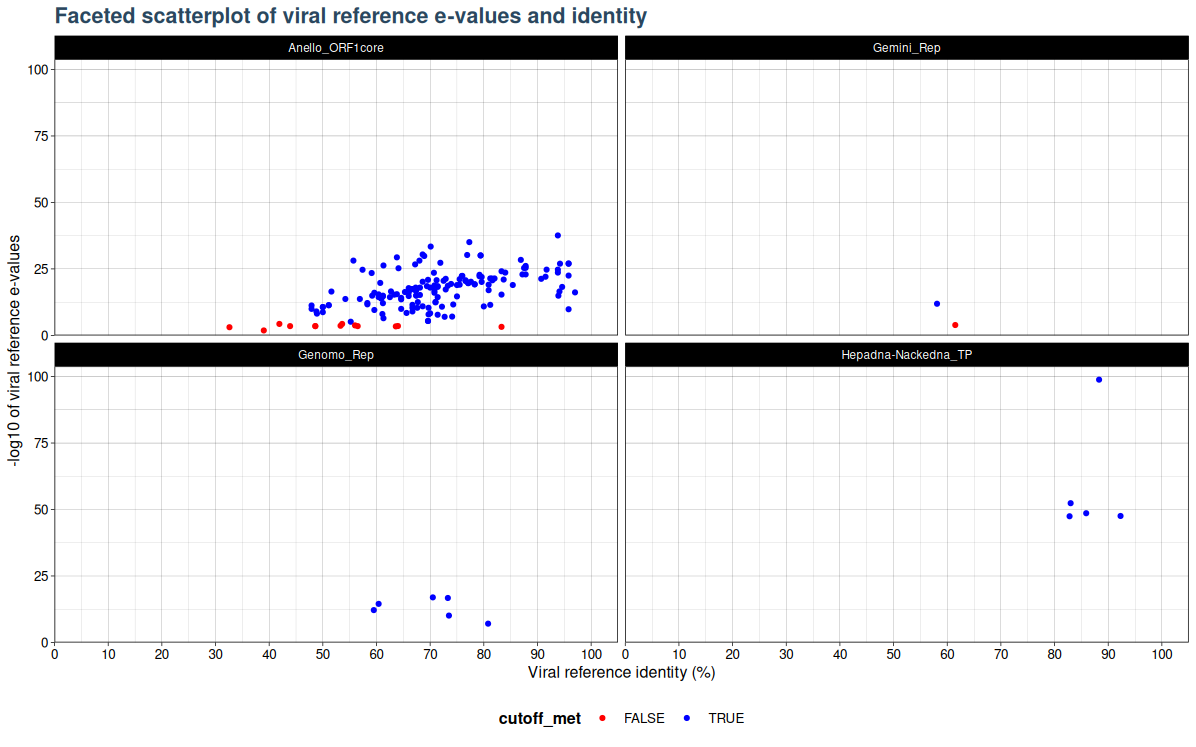
VhgIdenFacetedScatterPlot() generates a scatter plot with viral refrence identity ("ViralRefSeq_ident" column) on the x-axis and the -log10 of Viral reference e-values ("ViralRefSeq_E") on the y-axis. Here the cutoff is not used for filtering of values based on e-value threshold. Instead observations are coloured based on whether they are below or above the specified threshold. By default blue points indicate observations with e-values below the threshold and red indicates points above the threshold. Unlike VhgIdentityScatterPlot(), which plots every family in one plot, the VhgIdenFacetedScatterPlot() creates faceted plots for each group defined by groupby. This allows the user to better seperate virus groups into seperate plots, in cases where multiple groups cluster to closely together and groups are no longer distinguishable in the VhgIdentityScatterPlot() plot.
### Generate Plot

plot <- VhgIdenFacetedScatterPlot(vh_file,cutoff = 1e-5)
plot
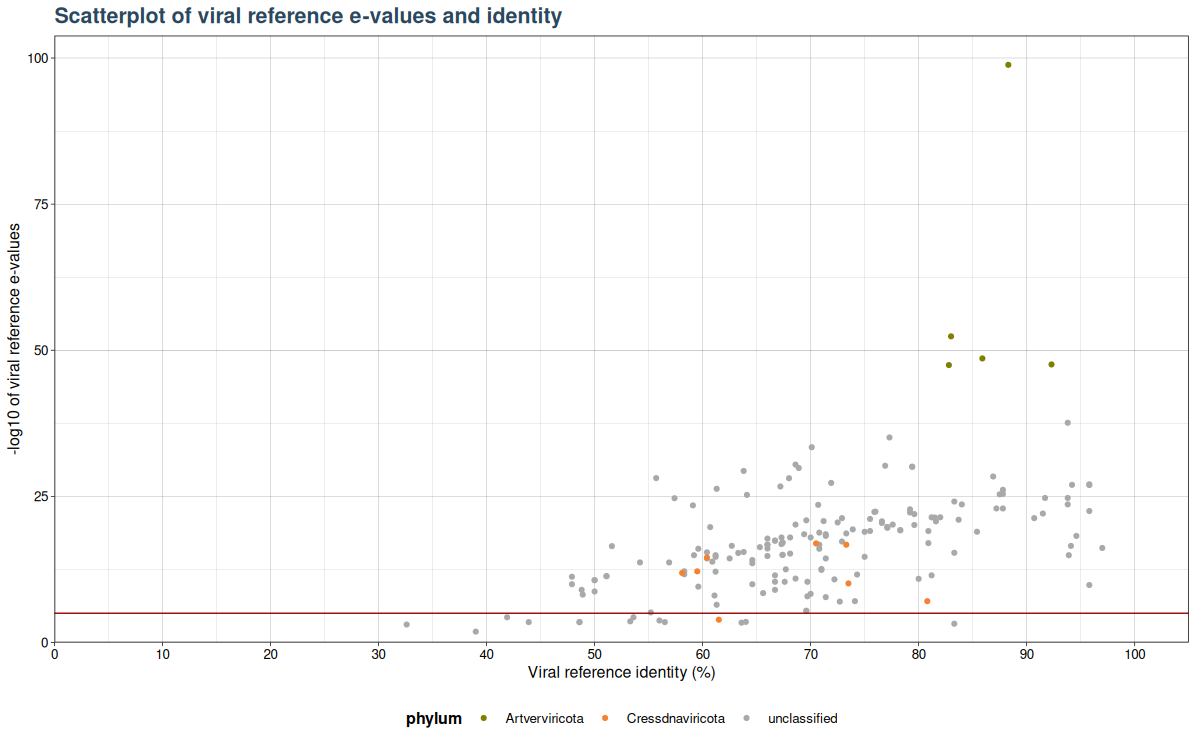
VhgIdentityScatterPlot() generates a scatter plot with viral refrence identity ("ViralRefSeq_ident" column) on the x-axis and the -log10 of Viral reference e-values ("ViralRefSeq_E") on the y-axis. Here the cutoff is not used for filtering of values based on e-value threshold.
Instead a red horizontal line is drawn (see figure below), which indicates whether observation is above or belo threshold. As the y-axis is on a -log10 scale values above the red line are below the specified threshold and values below the red line are above.
### Basic plot

plot <- VhgIdentityScatterPlot(vh_file,cutoff = 1e-5)
plot(plot)
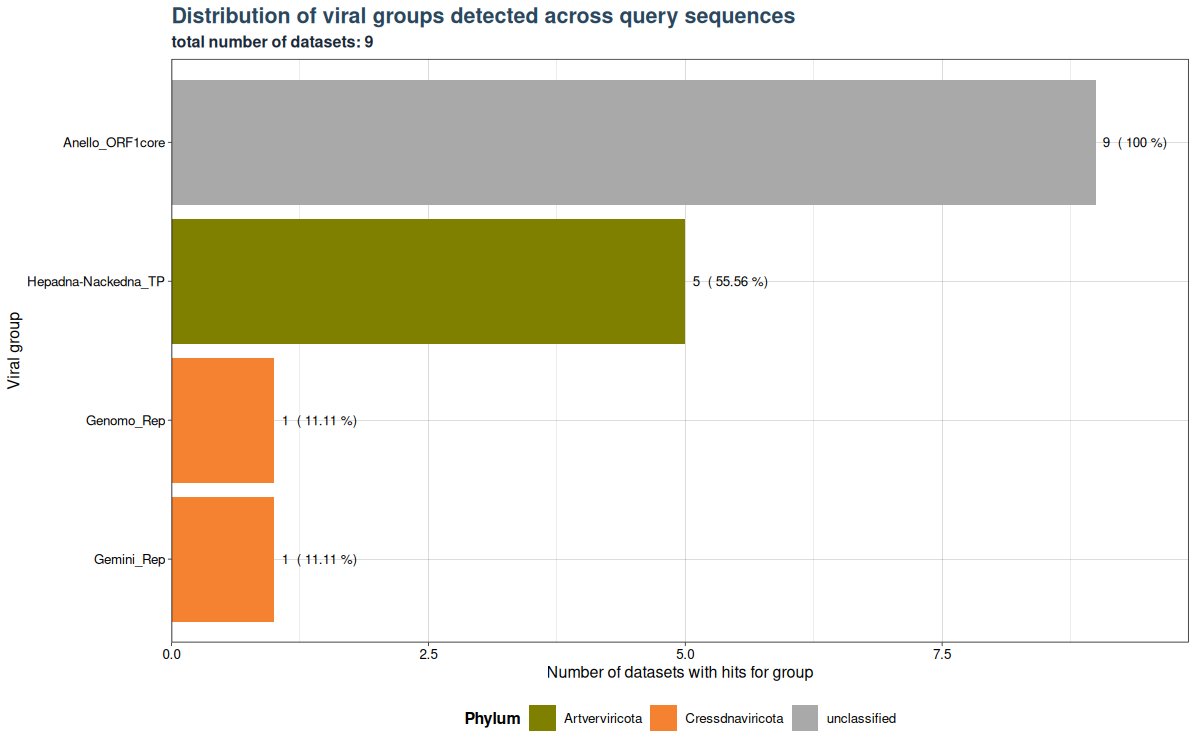
VhgRunsBarplot() takes a VirusHunterGatherer file as Input and plots the distribution of viral groups detected across query sequences. Here the cutoff is applied to filter out specific observations above a specified threshold. Meaning that if 10 unique SRA-Runs (or local FASTQ Files) detect a viral group, but only 9 have values below the threshold, then only 9 will be plotted.
In the example below we have 9 datasets (SRA_runs). We use "best_query" (groupby) for grouping on the x-axis (here inverted) and see the total number of datasets with hits for each group on the y-axis. Anello_ORF1core is found in all 9 files. 5 datasets contain observations for Hepadna-Nackedna_TP and both Gemini_Rep and Genomo_Rep have only 1.
### Generate Plot

plot <- VhgRunsBarplot(vh_file,cut = 1e-5)
plot
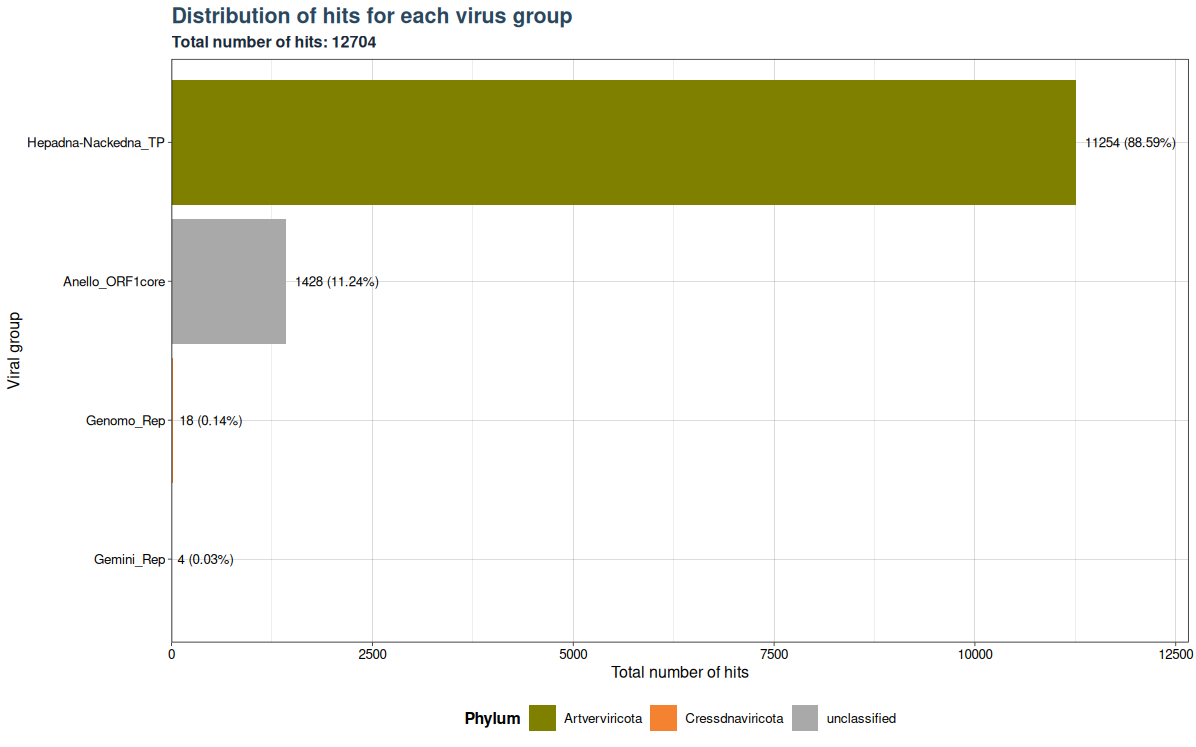
The "best_query" column shows the number of hits in your samples that match the sequences in the blast database (filtering step of VirusHunter). VhSumHitsBarplot() plots the sum of hits ("best_query") for each virus group specified by the groupby argument. The cutoff value is used to filter out observations above the threshold. Since the "best_query" column only exists in VirusHunter hittables, this function can only generate plots for VirusHunter hittables.
The example below shows that a total of 12704 hits exist in our data, but almost 89 % of the hits belong to Hepadna-Nackedna_TP, followed by Anello_ORF1core with 11.24 % and less than 1 % for both Genomo_Rep and Gemini_Rep.
### Generate Plot

plot <- VhSumHitsBarplot(vh_file,cut = 1e-5)
plot
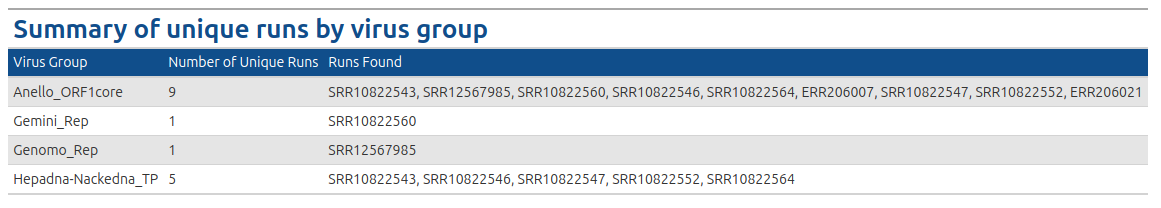
The VhgRunsTable() function takes VirusHunter files as input and generates a graphical table, providing the user with information about which run has found which virus group. This makes it a valuable complement to the VhgRunsBarplot() function. While VhgRunsBarplot() provides the information in a plot that quantifies the number of unique runs finding a virus group, VhgRunsTable() presents the same information in table form, showing which runs are found along with their names (SRA accessions, FASTQ).
VhgRunsBarplot() plots the distribution of viral groups detected across query sequences, but does not provide us with information about, which dataset detects a specific virus group. In the example above we see that 5 datasets contain observations for Hepadna-Nackedna_TP, but only VhgRunsTable() shows which files specificly detect Hepadna-Nackedna_TP (see table below).
### Generate table with defaul arguments

table <- VhgRunsTable(vh_file,cut = 1e-5)
table
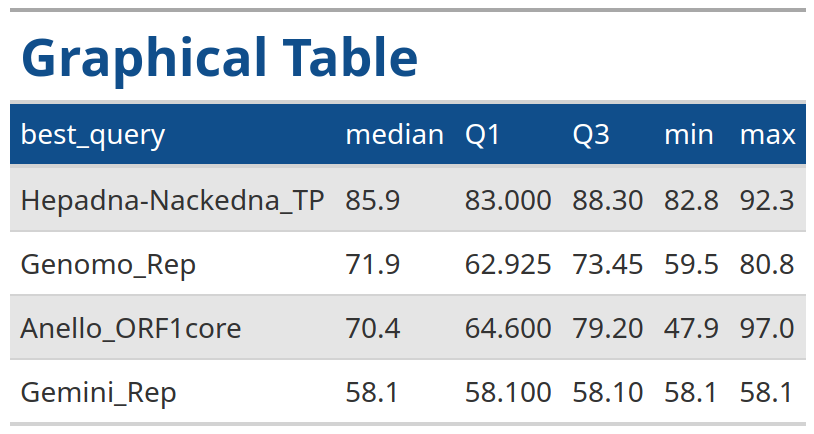
This function creates a formatted table using the gt package, based on input data with specified column names. It is particularly useful for generating tables that cannot be produced with VhgRunsTable().
Users have the option to generate tables with the same styling as the table generated by the VhgRunsTable() function but for the summary statistics objects generated by the Virusparies plot functions or the user defined objects.
In the example below we generate a table for the summary statistics output for VhgBoxplot() where y_column = "ViralRefSeq_ident" with the same style as the output from the VhgRunsTable() function.
### Plot boxplot for "identity"

identity <- VhgBoxplot(vh_file,y_column = "ViralRefSeq_ident")

# Generate table

VhgTabularRasa(identity$summary_stats)
Plots can be exported in various formats via the ExportVirusPlot() function. Supported formats include "eps", "ps", "tex", "pdf", "jpeg", "tiff", "png", "bmp", "svg", and "wmf" (Windows only). When the device argument is set to NULL, the file extension in filename is used to determine the export format.
### Generate Basic plot

plot <- VhgIdentityScatterPlot(vh_file,cutoff = 1e-5)


### Export plot

ExportVirusPlot(plot=plot,file_name="testplot.png",width=8,height=6,units="in")
! Depending on the plot, the final image might be cropped or truncated. We recommend experimenting with height, width, and resolution.
The ExportVirusGt() function utilizes the gtsave() function from the gt package to export graphical tables in various formats. This feature is currently in an experimental phase and may not operate as expected. ! Please note that exporting PNG and PDF files requires Google Chrome or a Chromium-based browser.
### Using first 10 rows of SRA_run,num_hits,bestquery,ViralRefSeq_E and Identity col.

vh_file_part <- vh_file[c(1:10),c(1,7,9,10,11)]

### Generating a gt

table <- VhgTabularRasa(vh_file_part,title = "first 10 rows of vh_file",subtit =
"example for any table",names_ = c("Runs","Number of Contigs","Best Query Result",
"Reference E-Value","Refrence Identity"))

### Export gt as docx file

ExportVirusGt(gtable=table,filename="vh_parttable.docx")
When utilizing Virusparies in your research or software development, kindly reference the R package using the citation obtained from the citation() function:
### Citation function

citation("Virusparies")

#> To cite package ‘Virusparies’ in publications use:
#>
#>   Ruff S (2024). _Virusparies: Data Visualisations for
#>   VirusHunterGatherer hittables output_. R package version
#>   1.0.0, <https://github.com/SergejRuff/Virusparies>.

#> A BibTeX entry for LaTeX users is

#>   @Manual{,
#>     title = {Virusparies: Data Visualisations for VirusHunterGatherer hittables output},
#>     author = {Sergej Ruff},
#>     url = {https://github.com/SergejRuff/Virusparies},
#>     year = {2024},
#>     note = {R package version 1.0.0},
#>   }
Sergej Ruff formulated the idea behind Virusparies and was responsible for its implementation.
Chris Lauber and Li Chuin Chong from Twincore - Centre for Experimental and Clinical Infection Research provided ideas for improvements. Chris Lauber is the main developer behind the VirusHuntergatherer software and the Group Leader of the Computational Virology working group at the Institute for Experimental Virology, TWINCORE.