We provide lots of useful tools under the tools/ directory. In addition, you can also quickly run other open source libraries of OpenMMLab through MIM.
Take MMDetection as an example. If you want to use print_config.py, you can directly use the following commands without copying the source code to the MMYOLO library.
mim run mmdet print_config ${CONFIG}tools/analysis_tools/browse_coco_json.py is a script that can visualization to display the COCO label in the picture.
python tools/analysis_tools/browse_coco_json.py [--data-root ${DATA_ROOT}] \
                                                [--img-dir ${IMG_DIR}] \
                                                [--ann-file ${ANN_FILE}] \
                                                [--wait-time ${WAIT_TIME}] \
                                                [--disp-all] [--category-names CATEGORY_NAMES [CATEGORY_NAMES ...]] \
                                                [--shuffle]
If images and labels are in the same folder, you can specify --data-root to the folder, and then --img-dir and --ann-file to specify the relative path of the folder. The code will be automatically spliced.
If the image and label files are not in the same folder, you do not need to specify --data-root, but directly specify --img-dir and --ann-file of the absolute path.
E.g:
- Visualize all categories of
COCOand display all types of annotations such asbboxandmask:
python tools/analysis_tools/browse_coco_json.py --data-root './data/coco' \
                                                --img-dir 'train2017' \
                                                --ann-file 'annotations/instances_train2017.json' \
                                                --disp-all
If images and labels are not in the same folder, you can use a absolutely path:
python tools/analysis_tools/browse_coco_json.py --img-dir '/dataset/image/coco/train2017' \
                                                --ann-file '/label/instances_train2017.json' \
--disp-all- Visualize all categories of
COCO, and display only thebboxtype labels, and shuffle the image to show:
python tools/analysis_tools/browse_coco_json.py --data-root './data/coco' \
                                                --img-dir 'train2017' \
                                                --ann-file 'annotations/instances_train2017.json' \
--shuffle- Only visualize the
bicycleandpersoncategories ofCOCOand only thebboxtype labels are displayed:
python tools/analysis_tools/browse_coco_json.py --data-root './data/coco' \
                                                --img-dir 'train2017' \
                                                --ann-file 'annotations/instances_train2017.json' \
--category-names 'bicycle' 'person'- Visualize all categories of
COCO, and display all types of label such asbbox,mask, and shuffle the image to show:
python tools/analysis_tools/browse_coco_json.py --data-root './data/coco' \
                                                --img-dir 'train2017' \
                                                --ann-file 'annotations/instances_train2017.json' \
                                                --disp-all \
--shuffletools/analysis_tools/browse_dataset.py helps the user to browse a detection dataset (both images and bounding box annotations) visually, or save the image to a designated directory.
python tools/analysis_tools/browse_dataset.py ${CONFIG} \
                                              [--out-dir ${OUT_DIR}] \
                                              [--not-show] \
                                              [--show-interval ${SHOW_INTERVAL}]
E,g:
- Use
configfileconfigs/yolov5/yolov5_s-v61_syncbn_8xb16-300e_coco.pyto visualize the picture. The picture will pop up directly and be saved to the directorywork_dirs/browse_ datasetat the same time:
python tools/analysis_tools/browse_dataset.py 'configs/yolov5/yolov5_s-v61_syncbn_8xb16-300e_coco.py' \
--out-dir 'work_dirs/browse_dataset'- Use
configfileconfigs/yolov5/yolov5_s-v61_syncbn_8xb16-300e_coco.pyto visualize the picture. The picture will pop up and display directly. Each picture lasts for10seconds. At the same time, it will be saved to the directorywork_dirs/browse_ dataset:
python tools/analysis_tools/browse_dataset.py 'configs/yolov5/yolov5_s-v61_syncbn_8xb16-300e_coco.py' \
                                              --out-dir 'work_dirs/browse_dataset' \
--show-interval 10- Use
configfileconfigs/yolov5/yolov5_s-v61_syncbn_8xb16-300e_coco.pyto visualize the picture. The picture will pop up and display directly. Each picture lasts for10seconds and the picture will not be saved:
python tools/analysis_tools/browse_dataset.py 'configs/yolov5/yolov5_s-v61_syncbn_8xb16-300e_coco.py' \
--show-interval 10- Use
configfileconfigs/yolov5/yolov5_s-v61_syncbn_8xb16-300e_coco.pyto visualize the picture. The picture will not pop up directly, but only saved to the directorywork_dirs/browse_ dataset:
python tools/analysis_tools/browse_dataset.py 'configs/yolov5/yolov5_s-v61_syncbn_8xb16-300e_coco.py' \
                                              --out-dir 'work_dirs/browse_dataset' \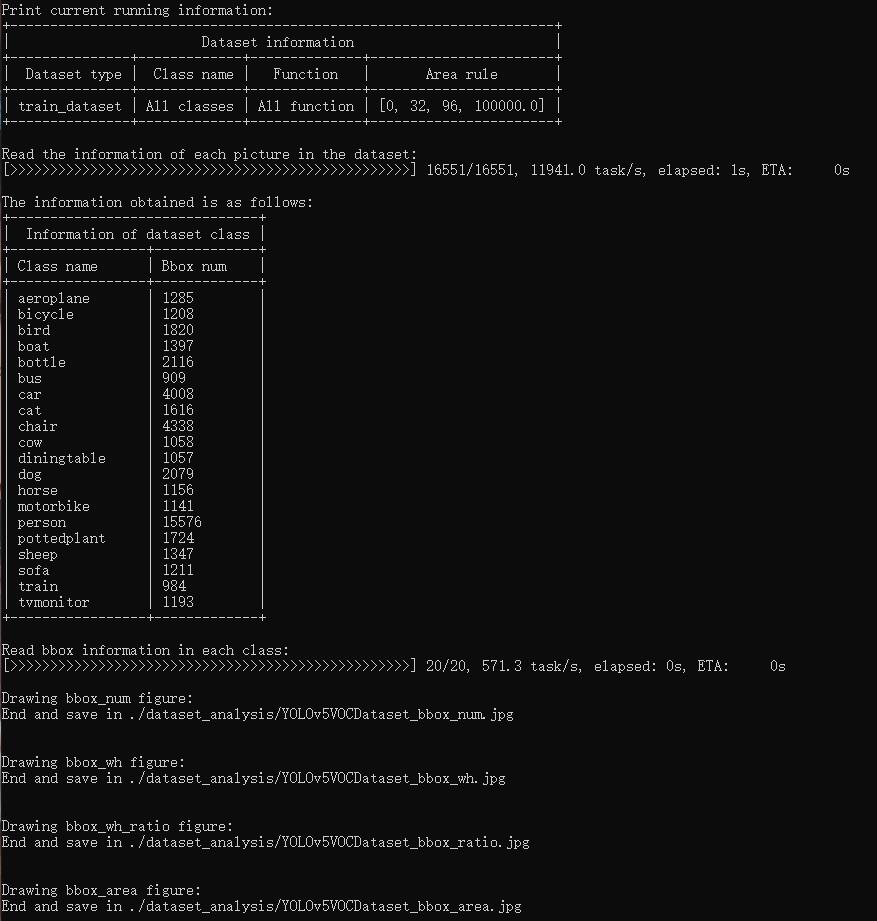
--not-showtools/analysis_tools/dataset_analysis.py help users get the renderings of the four functions, and save the pictures to the dataset_analysis folder under the current running directory.
Description of the script's functions:
The data required by each sub function is obtained through the data preparation of main().
Function 1: Generated by the sub function show_bbox_num to display the distribution of categories and bbox instances.
Function 2: Generated by the sub function show_bbox_wh to display the width and height distribution of categories and bbox instances.
Function 3: Generated by the sub function show_bbox_wh_ratio to display the width to height ratio distribution of categories and bbox instances.
Function 3: Generated by the sub function show_bbox_area to display the distribution map of category and bbox instance area based on area rules.
Print List: Generated by the sub function show_class_list and show_data_list.
python tools/analysis_tools/dataset_analysis.py ${CONFIG} \
                                                [--type ${TYPE}] \
                                                [--class-name ${CLASS_NAME}] \
                                                [--area-rule ${AREA_RULE}] \
                                                [--func ${FUNC}] \
                                                [--out-dir ${OUT_DIR}]
E,g:
1.Use config file configs/yolov5/voc/yolov5_s-v61_fast_1xb64-50e_voc.py analyze the dataset, By default,the data loading type is train_dataset, the area rule is [0,32,96,1e5], generate a result graph containing all functions and save the graph to the current running directory ./dataset_analysis folder:
python tools/analysis_tools/dataset_analysis.py configs/yolov5/voc/yolov5_s-v61_fast_1xb64-50e_voc.py2.Use config file configs/yolov5/voc/yolov5_s-v61_fast_1xb64-50e_voc.py analyze the dataset, change the data loading type from the default train_dataset to val_dataset through the --val-dataset setting:
python tools/analysis_tools/dataset_analysis.py configs/yolov5/voc/yolov5_s-v61_fast_1xb64-50e_voc.py \
                                                --val-dataset
3.Use config file configs/yolov5/voc/yolov5_s-v61_fast_1xb64-50e_voc.py analyze the dataset, change the display of all generated classes to specific classes. Take the display of person classes as an example:
python tools/analysis_tools/dataset_analysis.py configs/yolov5/voc/yolov5_s-v61_fast_1xb64-50e_voc.py \
                                                --class-name person
4.Use config file configs/yolov5/voc/yolov5_s-v61_fast_1xb64-50e_voc.py analyze the dataset, redefine the area rule through --area-rule . Take 30 70 125 as an example, the area rule becomes [0,30,70,125,1e5]:
python tools/analysis_tools/dataset_analysis.py configs/yolov5/voc/yolov5_s-v61_fast_1xb64-50e_voc.py \
                                                --area-rule 30 70 125
5.Use config file configs/yolov5/voc/yolov5_s-v61_fast_1xb64-50e_voc.py analyze the dataset, change the display of four function renderings to only display Function 1 as an example:
python tools/analysis_tools/dataset_analysis.py configs/yolov5/voc/yolov5_s-v61_fast_1xb64-50e_voc.py \
                                                --func show_bbox_num
6.Use config file configs/yolov5/voc/yolov5_s-v61_fast_1xb64-50e_voc.py analyze the dataset, modify the picture saving address to work_dirs/dataset_analysis:
python tools/analysis_tools/dataset_analysis.py configs/yolov5/voc/yolov5_s-v61_fast_1xb64-50e_voc.py \
--out-dir work_dirs/dataset_analysistools/analysis_tools/vis_scheduler aims to help the user to check the hyper-parameter scheduler of the optimizer(without training), which support the "learning rate", "momentum", and "weight_decay".
python tools/analysis_tools/vis_scheduler.py \
    ${CONFIG_FILE} \
    [-p, --parameter ${PARAMETER_NAME}] \
    [-d, --dataset-size ${DATASET_SIZE}] \
    [-n, --ngpus ${NUM_GPUs}] \
    [-o, --out-dir ${OUT_DIR}] \
    [--title ${TITLE}] \
    [--style ${STYLE}] \
    [--window-size ${WINDOW_SIZE}] \
    [--cfg-options]
Description of all arguments:
config: The path of a model config file.-p, --parameter: The param to visualize its change curve, choose from "lr", "momentum" or "wd". Default to use "lr".-d, --dataset-size: The size of the datasets. If set,DATASETS.buildwill be skipped and${DATASET_SIZE}will be used as the size. Default to use the functionDATASETS.build.-n, --ngpus: The number of GPUs used in training, default to be 1.-o, --out-dir: The output path of the curve plot, default not to output.--title: Title of figure. If not set, default to be config file name.--style: Style of plt. If not set, default to bewhitegrid.--window-size: The shape of the display window. If not specified, it will be set to12*7. If used, it must be in the format'W*H'.--cfg-options: Modifications to the configuration file, refer to Learn about Configs.
Loading annotations maybe consume much time, you can directly specify the size of the dataset with `-d, dataset-size` to save time.
You can use the following command to plot the step learning rate schedule used in the config configs/rtmdet/rtmdet_s_syncbn_fast_8xb32-300e_coco.py:
python tools/analysis_tools/vis_scheduler.py \
    configs/rtmdet/rtmdet_s_syncbn_fast_8xb32-300e_coco.py \
    --dataset-size 118287 \
    --ngpus 8 \
    --out-dir ./output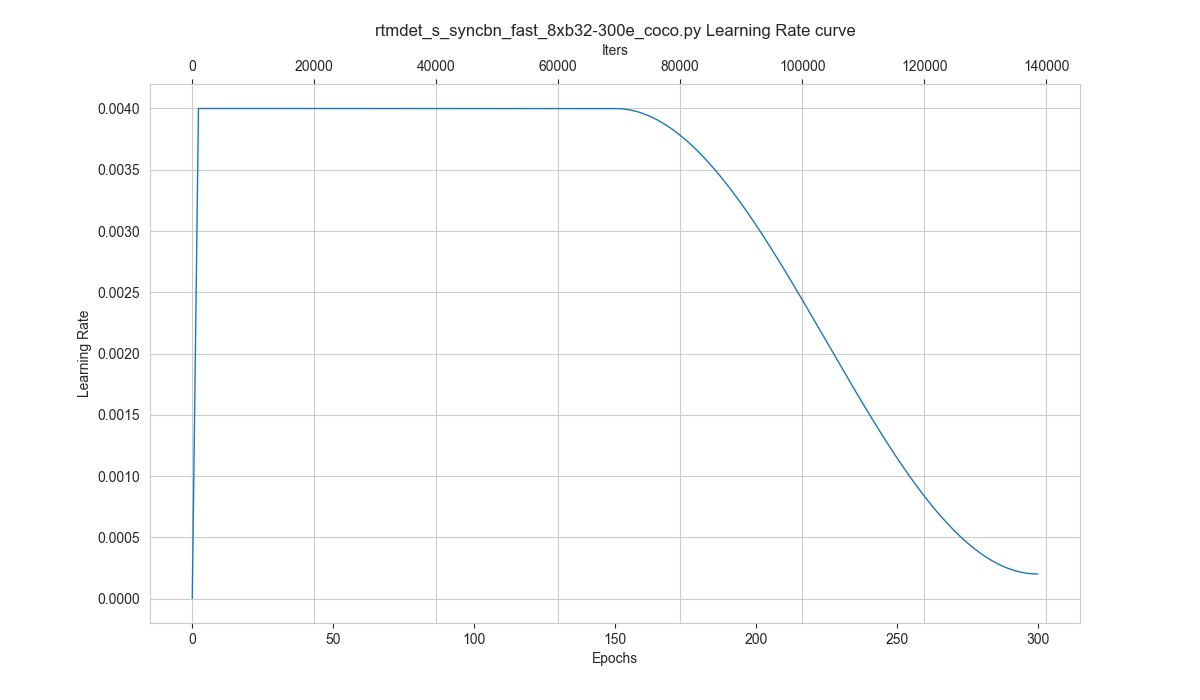
The folder tools/data_converters currently contains ballon2coco.py, yolo2coco.py, and labelme2coco.py - three dataset conversion tools.
ballon2coco.pyconverts theballoondataset (this small dataset is for starters only) to COCO format.
For a detailed description of this script, please see the Dataset Preparation section in From getting started to deployment with YOLOv5.
python tools/dataset_converters/balloon2coco.pyyolo2coco.pyconverts a dataset fromyolo-style.txt format to COCO format, please use it as follows:
python tools/dataset_converters/yolo2coco.py /path/to/the/root/dir/of/your_datasetInstructions:
image_diris the root directory of the yolo-style dataset you need to pass to the script, which should containimages,labels, andclasses.txt.classes.txtis the class declaration corresponding to the current dataset. One class a line. The structure of the root directory should be formatted as this example shows:
.
└── $ROOT_PATH
    ├── classes.txt
    ├── labels
    │    ├── a.txt
    │    ├── b.txt
    │    └── ...
    ├── images
    │    ├── a.jpg
    │    ├── b.png
    │    └── ...
└── ...- The script will automatically check if
train.txt,val.txt, andtest.txthave already existed underimage_dir. If these files are located, the script will organize the dataset accordingly. Otherwise, the script will convert the dataset into one file. The image paths in these files must be ABSOLUTE paths. - By default, the script will create a folder called
annotationsin theimage_dirdirectory which stores the converted JSON file. Iftrain.txt,val.txt, andtest.txtare not found, the output file isresult.json. Otherwise, the corresponding JSON file will be generated, named astrain.json,val.json, andtest.json. Theannotationsfolder may look similar to this:
.
└── $ROOT_PATH
    ├── annotations
    │    ├── result.json
    │    └── ...
    ├── classes.txt
    ├── labels
    │    ├── a.txt
    │    ├── b.txt
    │    └── ...
    ├── images
    │    ├── a.jpg
    │    ├── b.png
    │    └── ...
└── ...tools/misc/download_dataset.py supports downloading datasets such as COCO, VOC, LVIS and Balloon.
python tools/misc/download_dataset.py --dataset-name coco2017
python tools/misc/download_dataset.py --dataset-name voc2007
python tools/misc/download_dataset.py --dataset-name voc2012
python tools/misc/download_dataset.py --dataset-name lvis
python tools/misc/download_dataset.py --dataset-name balloon [--save-dir ${SAVE_DIR}] [--unzip]The six scripts under the tools/model_converters directory can help users convert the keys in the official pre-trained model of YOLO to the format of MMYOLO, and use MMYOLO to fine-tune the model.
Take conversion yolov5s.pt as an example:
- Clone the official YOLOv5 code to the local (currently the maximum supported version is
v6.1):
git clone -b v6.1 https://github.com/ultralytics/yolov5.git
cd yolov5- Download official weight file:
wget https://github.com/ultralytics/yolov5/releases/download/v6.1/yolov5s.pt- Copy file
tools/model_converters/yolov5_to_mmyolo.pyto the path of YOLOv5 official code clone:
cp ${MMDET_YOLO_PATH}/tools/model_converters/yolov5_to_mmyolo.py yolov5_to_mmyolo.py- Conversion
python yolov5_to_mmyolo.py --src ${WEIGHT_FILE_PATH} --dst mmyolov5.ptThe converted mmyolov5.pt can be used by MMYOLO. The official weight conversion of YOLOv6 is also used in the same way.
The conversion of YOLOX model does not need to download the official YOLOX code, just download the weight.
Take conversion yolox_s.pth as an example:
- Download official weight file:
wget https://github.com/Megvii-BaseDetection/YOLOX/releases/download/0.1.1rc0/yolox_s.pth- Conversion
python tools/model_converters/yolox_to_mmyolo.py --src yolox_s.pth --dst mmyolox.ptThe converted mmyolox.pt can be used by MMYOLO.
Script tools/analysis_tools/optimize_anchors.py supports three methods to optimize YOLO anchors including k-means
anchor cluster, Differential Evolution and v5-k-means.
In k-means method, the distance criteria is based IoU, python shell as follow:
python tools/analysis_tools/optimize_anchors.py ${CONFIG} \
                                                --algorithm k-means \
                                                --input-shape ${INPUT_SHAPE [WIDTH HEIGHT]} \
--out-dir ${OUT_DIR}In differential_evolution method, based differential evolution algorithm, use avg_iou_cost as minimum target function, python shell as follow:
python tools/analysis_tools/optimize_anchors.py ${CONFIG} \
                                                --algorithm DE \
                                                --input-shape ${INPUT_SHAPE [WIDTH HEIGHT]} \
--out-dir ${OUT_DIR}In v5-k-means method, clustering standard as same with YOLOv5 which use shape-match, python shell as follow:
python tools/analysis_tools/optimize_anchors.py ${CONFIG} \
                                                --algorithm v5-k-means \
                                                --input-shape ${INPUT_SHAPE [WIDTH HEIGHT]} \
                                                --prior_match_thr ${PRIOR_MATCH_THR} \
--out-dir ${OUT_DIR}First install sahi with:
pip install -U sahi>=0.11.4Perform MMYOLO inference on large images (as satellite imagery) as:
wget -P checkpoint https://download.openmmlab.com/mmyolo/v0/yolov5/yolov5_m-v61_syncbn_fast_8xb16-300e_coco/yolov5_m-v61_syncbn_fast_8xb16-300e_coco_20220917_204944-516a710f.pth

python demo/large_image_demo.py \
    demo/large_image.jpg \
    configs/yolov5/yolov5_m-v61_syncbn_fast_8xb16-300e_coco.py \
    checkpoint/yolov5_m-v61_syncbn_fast_8xb16-300e_coco_20220917_204944-516a710f.pth \
Arrange slicing parameters as:
python demo/large_image_demo.py \
    demo/large_image.jpg \
    configs/yolov5/yolov5_m-v61_syncbn_fast_8xb16-300e_coco.py \
    checkpoint/yolov5_m-v61_syncbn_fast_8xb16-300e_coco_20220917_204944-516a710f.pth \
    --patch-size 512
    --patch-overlap-ratio 0.25
Export debug visuals while performing inference on large images as:
python demo/large_image_demo.py \
    demo/large_image.jpg \
    configs/yolov5/yolov5_m-v61_syncbn_fast_8xb16-300e_coco.py \
    checkpoint/yolov5_m-v61_syncbn_fast_8xb16-300e_coco_20220917_204944-516a710f.pth \
    --debug
sahi citation:
@article{akyon2022sahi,
  title={Slicing Aided Hyper Inference and Fine-tuning for Small Object Detection},
  author={Akyon, Fatih Cagatay and Altinuc, Sinan Onur and Temizel, Alptekin},
  journal={2022 IEEE International Conference on Image Processing (ICIP)},
  doi={10.1109/ICIP46576.2022.9897990},
  pages={966-970},
  year={2022}
}
The training dataset of the COCO2017 dataset includes 118K images, and the validation set includes 5K images, which is a relatively large dataset. Loading JSON in debugging or quick verification scenarios will consume more resources and bring slower startup speed.
The extract_subcoco.py script provides the ability to extract a specified number/classes/area-size of images. The user can use the --num-img, --classes, --area-size parameter to get a COCO subset of the specified condition of images.
For example, extract images use scripts as follows:
python tools/misc/extract_subcoco.py \
    ${ROOT} \
    ${OUT_DIR} \
    --num-img 20 \
    --classes cat dog person \
    --area-size small
It gone be extract 20 images, and only includes annotations which belongs to cat(or dog/person) and bbox area size is small, after filter by class and area size, the empty annotation images won't be chosen, guarantee the images be extracted definitely has annotation info.
Currently, only support COCO2017. In the future will support user-defined datasets of standard coco JSON format.
The root path folder format is as follows:
├── root
│   ├── annotations
│   ├── train2017
│   ├── val2017
│   ├── test2017
- Extract 10 training images and 10 validation images using only 5K validation sets.
python tools/misc/extract_subcoco.py ${ROOT} ${OUT_DIR} --num-img 10- Extract 20 training images using the training set and 20 validation images using the validation set.
python tools/misc/extract_subcoco.py ${ROOT} ${OUT_DIR} --num-img 20 --use-training-set- Set the global seed to 1. The default is no setting.
python tools/misc/extract_subcoco.py ${ROOT} ${OUT_DIR} --num-img 20 --use-training-set --seed 1- Extract images by specify classes
python tools/misc/extract_subcoco.py ${ROOT} ${OUT_DIR} --classes cat dog person- Extract images by specify anchor size
python tools/misc/extract_subcoco.py ${ROOT} ${OUT_DIR} --area-size small