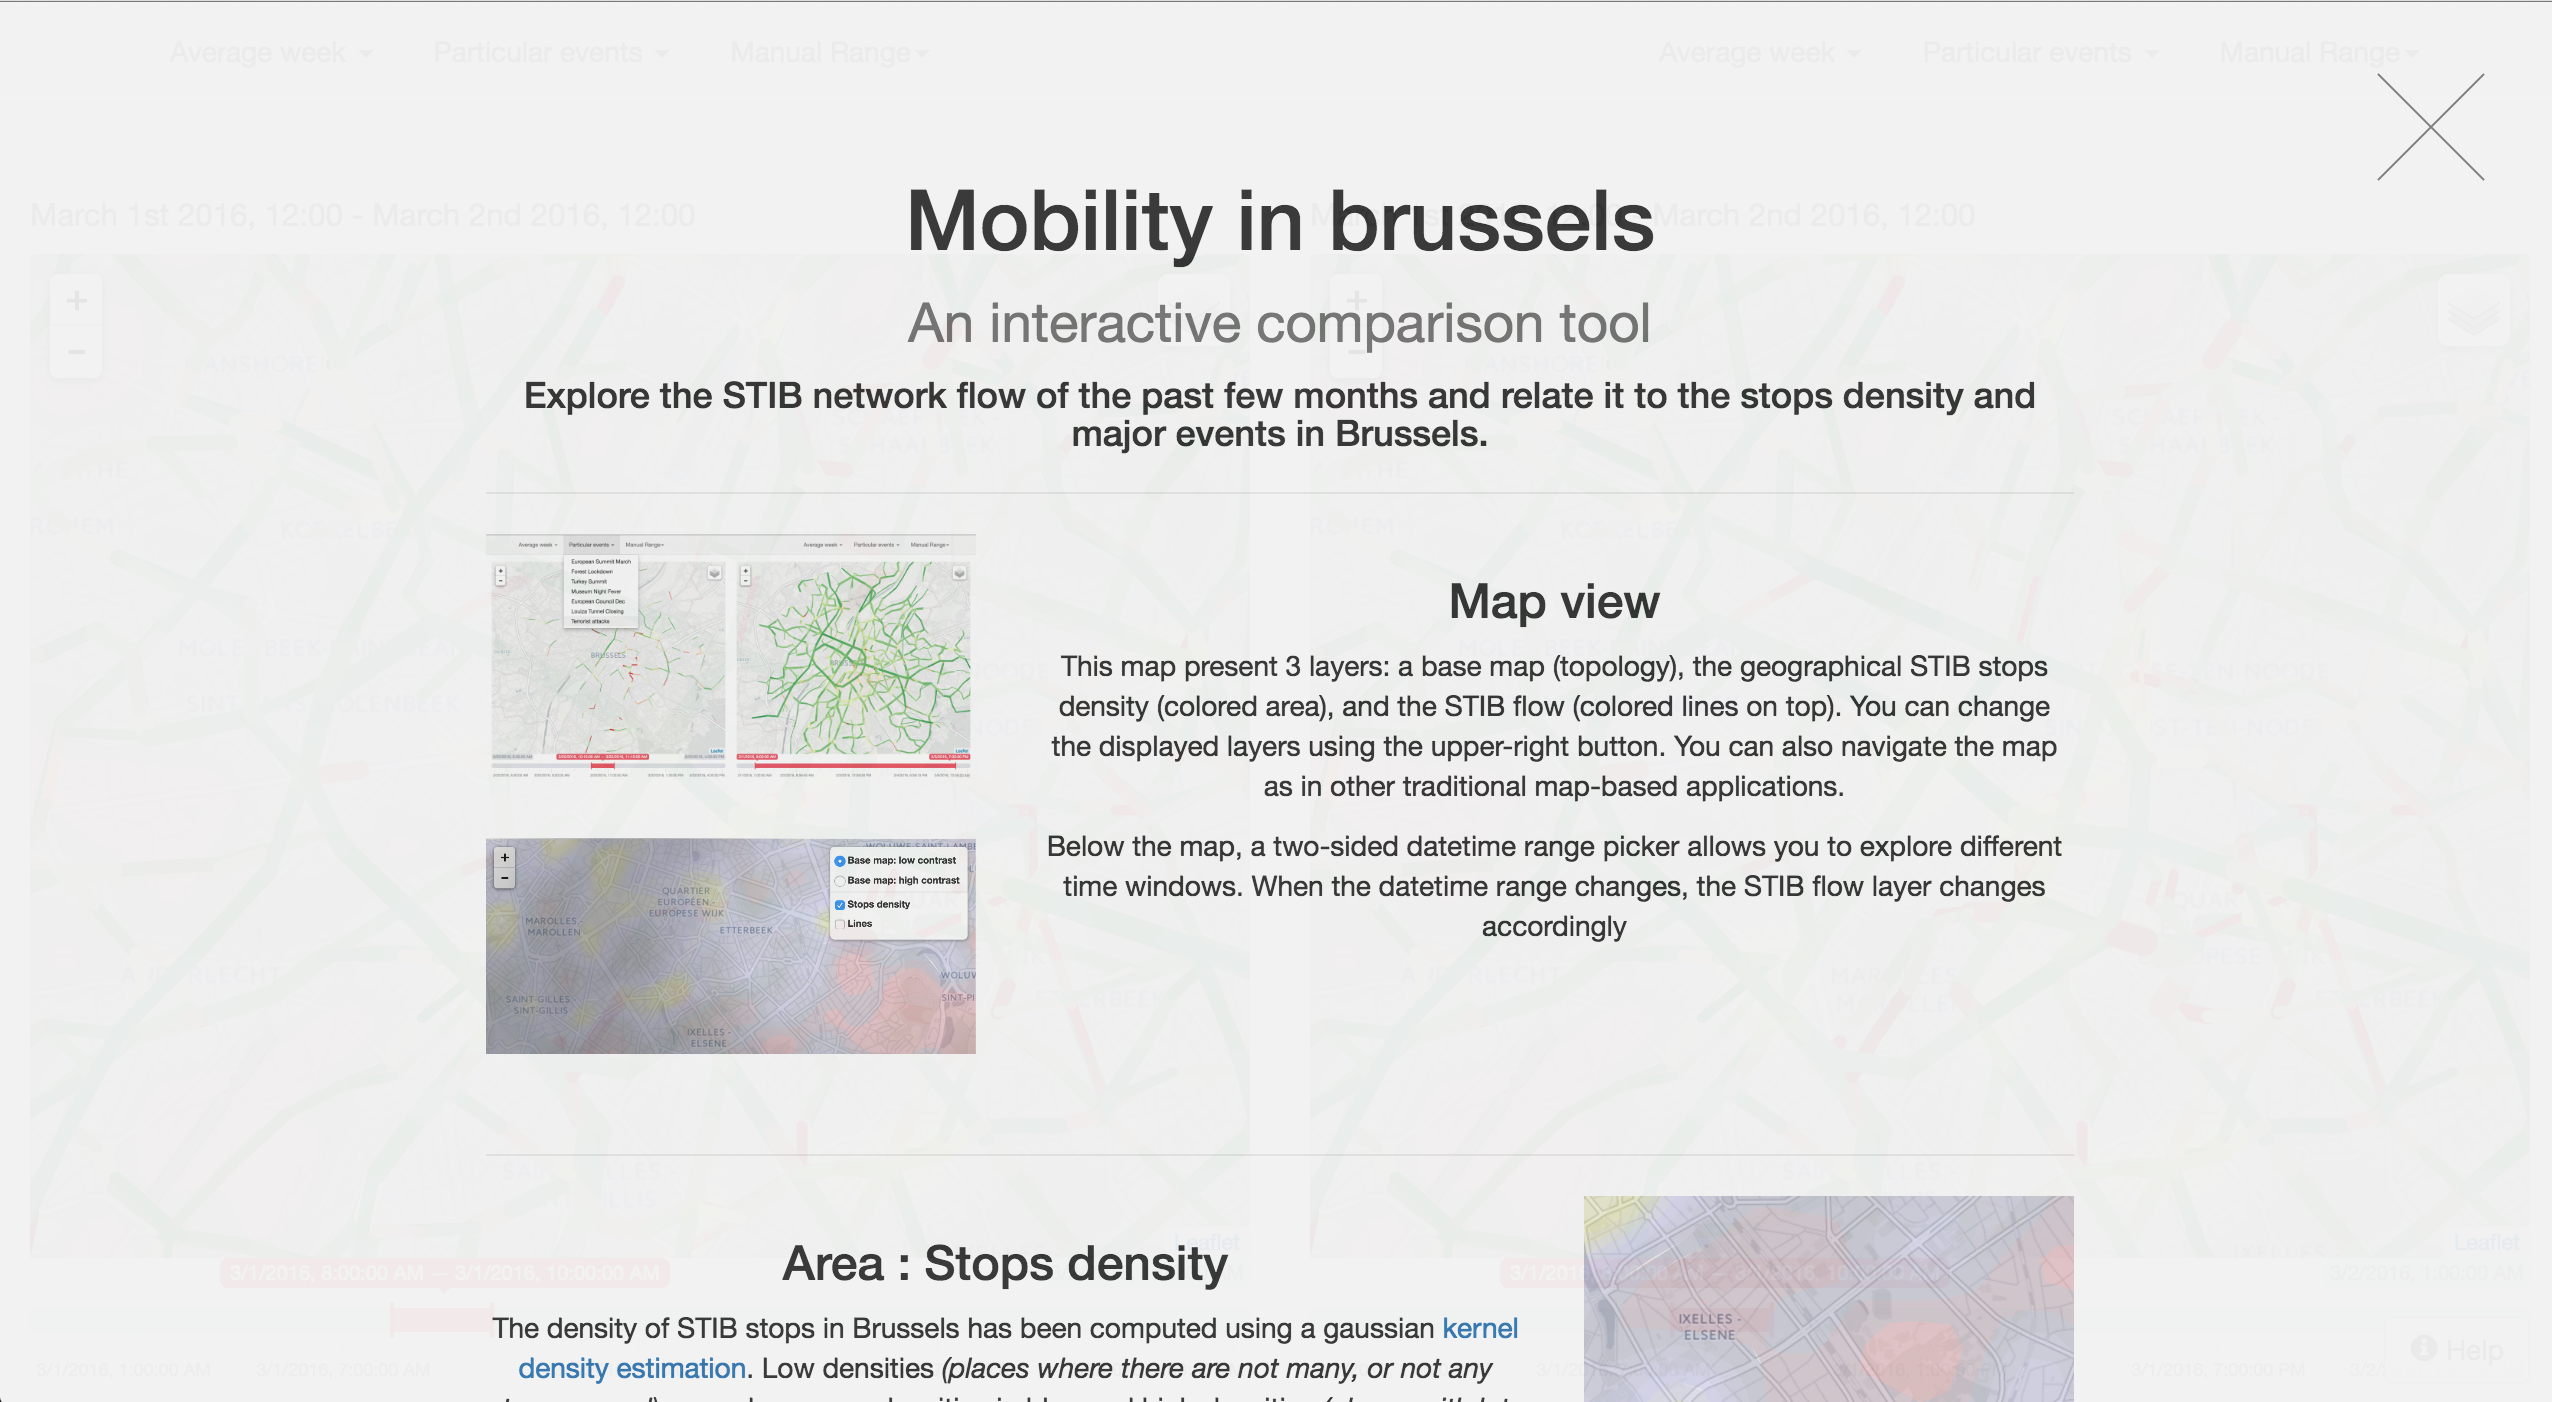
app/ : this folder contains the app itself.
utils/ : this foler contains utilities used to make the project. e.g. it contains the ipython notebook used to make the density layout.
screenshot/ : this folder contains a series of screenshot illustrating our application running.
You can run the client by following the readme in app/README.txt .
You can't run the server since it require the postgresql database whose size excess 2Gb and it did not seem reasonnable to send it to you by email. If you wish it nevertheless, please send us an email and we will find a solution to hand it over to you.
A live instance of our application is available at : infoviz.ititou.be
Please note that the instance will be disabled on the 15th June, please email us if you would like to run it afterwards.
Many open-source framework have been used and some part of the code might come directly from the documentation of that framework. Here is a list of the framework used
1: http://opendata.bruxelles.be/explore/dataset/arrets-stib/
4: http://ionden.com/a/plugins/ion.rangeSlider/en.html
Some other python packet and many other npm module has also been used. It is not possible to cite them all since the dependencie tree can be huge.
Please also see the report for more source.

