Add true log scale to line chart #1507
Conversation
048a52e
to
257536f
Compare
| } | ||
|
|
||
| /** | ||
| * Adds some padding to a given domain. Specifically, it: |
There was a problem hiding this comment.
FWIW, it would seem more consistent if padProportion were always used to determine the padding factor, rather than effectively using 0.1 instead for the edge cases outlined below.
That way the logic is more streamlined - you can mostly just adjust the domain, and only apply padding in one consistent way at the end. And it's easier to catch extra edge cases in domain adjustment that the current logic isn't handling, like a === b === 0 and also the expansion in the case where a/2 < b < 0.
let [a, b] = domain;
if (a === b) {
  if (a > 0) {
    [a, b] = [0, 2a];
  } else if (a < 0) {
    [a, b] = [2a, 0];
  } else {
    [a, b] = [-1, 1];
  }
} else if (0 < a && a < b/2) {
  a = 0;
} else if (a/2 < b && b < 0) {
  b = 0;
}
padding = (b - a) * this.padProportion();
return super._niceDomain([a - padding, b + padding], count);| // If b===a, we would create an empty range. We instead select the range | ||
| // [0, 2*a] if a > 0, or [-2*a, 0] if a < 0, plus a little bit of | ||
| // extra padding on the top and bottom of the plot. | ||
| padding = Math.abs(a) * 1.1 + 1.1; |
There was a problem hiding this comment.
Should that extra + 1.1 be there? This doesn't seem quite right because the final lower bound will be a - |a| * 1.1 - 1.1 which for a > 0 is -0.1 |a| - 1.1 and for a < 0 is -2.1 |a| - 1.1. There's always a -1.1 fixed offset that isn't subject to any scaling, which doesn't match the description above.
There was a problem hiding this comment.
Not answering your question directly, I took the code directly from
https://github.com/tensorflow/tensorboard/blob/master/tensorboard/components/vz_chart_helpers/vz-chart-helpers.ts#L154-L178
Instead of focusing on correctness, I made sure the linear scale remains exactly as is today. I honestly do not exactly understand the original author's intension here.
| /** | ||
| * Adds some padding to a given domain. Specifically, it: | ||
| * - returns about [-0.1a, 2.1a] when a = b and a >= 0. | ||
| * - returns about [-2.1a, 0.1a] when a = b and a < 0. |
There was a problem hiding this comment.
Strictly speaking, this is [2.1a, -0.1a] (inverted negatives) since by definition we have a < 0 here. Perhaps what would be clearest is to express it as [-2.1 |a|, -0.1 |a|] (aka the absolute value of a).
| } | ||
|
|
||
| /** | ||
| * Given a domain, pad it and clip the lower bound to MIN_VALUE. |
There was a problem hiding this comment.
What's the reason we need to clip to MIN_VALUE? Does the pow(log()) conversion just become unreliable past that point or something? It seems like if at all possible we should avoid introducing thresholds like this that distort the mathematical soundness, since that's the whole motivation for replacing ModifiedLogScale in the first place.
There was a problem hiding this comment.
It seems like if at all possible we should avoid introducing thresholds like this that distort the mathematical soundness, since that's the whole motivation for replacing ModifiedLogScale in the first place.
JavaScript does not have infinite precision and starts to behave very oddly starting from one point.
> 1e-16 * 1e-30
< 1e-46
> 1e-16 * 1e-40
< 9.999999999999999e-57
> 1e-16 * 1e-50
< 1e-66
> 1e-15 * 1e-1
< 1.0000000000000001e-16
I decided to put some arbitrary precision without reading too much about the ECMAScript spec but regardless, it seems like there is a lower bound to Math.log10(x) before it is regarded as negative infinity. I will make sure the MIN_VALUE is smaller but it is inevitable that we have some arbitrary value where we clip.
There was a problem hiding this comment.
The odd behavior there looks like regular floating point representation errors - the actual values are still essentially correct up to minute precision. Fair enough that some clipping is required but I do think it's better to have it be as small as technically possible vs. just 10^-15.
| const MIN_VALUE = 1e-15; | ||
|
|
||
| function log(x: number): number { | ||
| return Math.log(x) / Math.log(10); |
| const values = super._getAllIncludedValues(); | ||
| // For log scale, the value cannot be smaller or equal to 0. They are | ||
| // negative infinity. | ||
| return values.map(x => x > 0 ? x : MIN_VALUE); |
There was a problem hiding this comment.
Can we return NaN or something here that skips the plotting entirely, rather than having a flat line at MIN_VALUE? It's just not as mathematically accurate (especially if there is actual data in the range of MIN_VALUE).
There was a problem hiding this comment.
Hmm this method is not returning values for the plot. It is returning datasets values of all plots for sake of calculating the bounds. Since this log scale cannot show numbers smaller than some arbitrary x we use, it is correct that we clip these values here.
| * Plottable.Scale is a class that wraps the d3.scale that adds many utility | ||
| * methods that work with the Plottable's `dataset` concept. Here, we will | ||
| * attempt to explain few basic concepts in plain English. | ||
| * - domain: [f(min(x)), f(max(x))] |
There was a problem hiding this comment.
This isn't quite the normal definition of domain. Relative to the Scale, the domain is really the minimum and maximum input values of the scale (taken over all its extents of what it needs to display), so it's more like [min(vals from all extents), max(vals from all extents)].
I'm not sure exactly what the f() is here, but in the case where we're consider the Y-scale and the plot represents values of some function f(x) plotted on the Y axis against x on the X axis, then the domain of the Y-scale would be roughly speaking [min(f(x) for all x), max(f(x) for all x)] - but that's different from what's described here.
|
It roughly looks like this: Linear Linear |
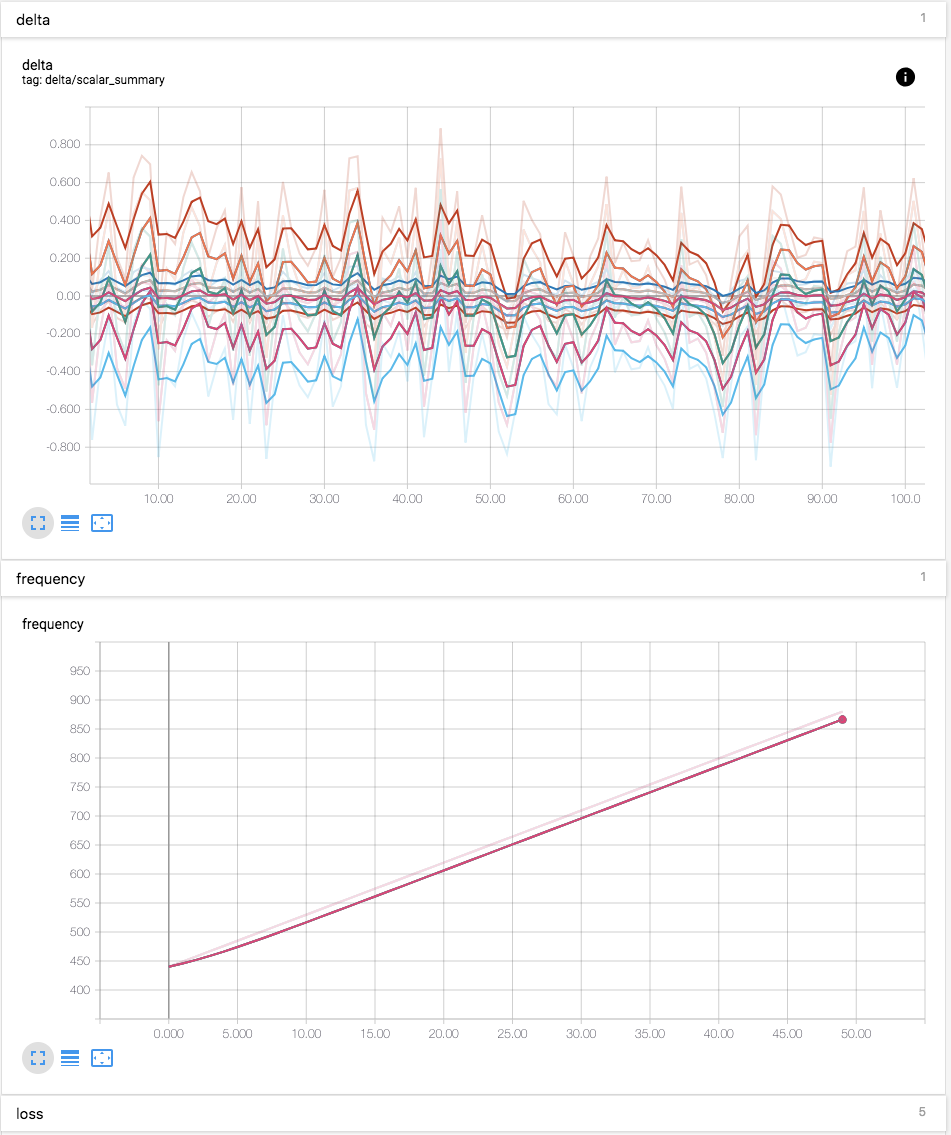
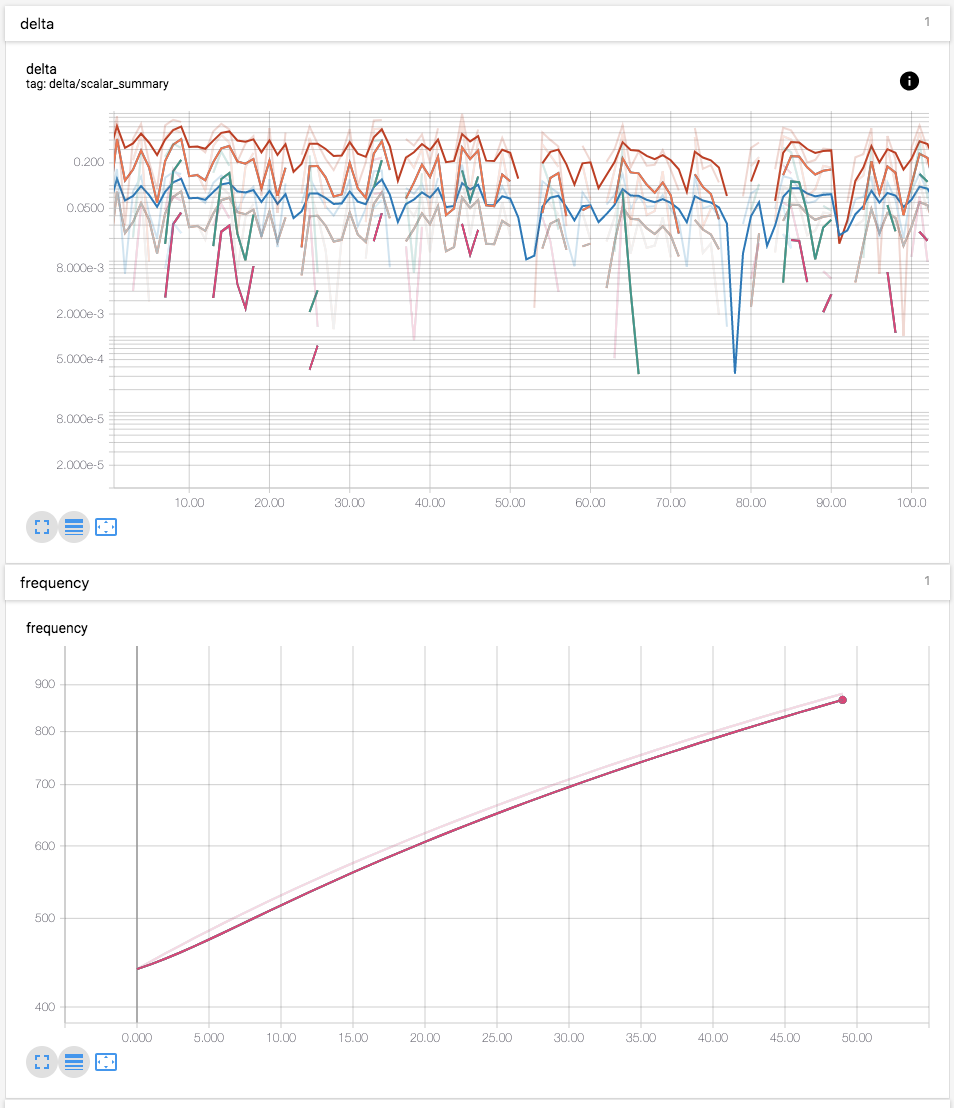

Line chart was using Plottable.Scale.ModifiedLogScale which treated
values near (0, 1] very differently than what log does. This handles
negative value (wrong but data is presented) and sometimes present line
chart very nicely but it works against researchers' expectation.
| * - returns [-0.1b, b + padProportion * (b-a)] if b > 2a and a > 0 | ||
| * - else, pads by `padProportion` | ||
| * Note that `c` is a constant offset which specifically is 1.1. Please refer |
There was a problem hiding this comment.
Can you add a TODO(nickfelt) here to revisit whether this offset is actually intentional/helpful?
| } | ||
|
|
||
| /** | ||
| * Given a domain, pad it and clip the lower bound to MIN_VALUE. |
There was a problem hiding this comment.
The odd behavior there looks like regular floating point representation errors - the actual values are still essentially correct up to minute precision. Fair enough that some clipping is required but I do think it's better to have it be as small as technically possible vs. just 10^-15.
|
@stephanwlee Thanks for fixing this, the modified log scaling has been bothering me for ages! |
Line chart was using Plottable.Scale.ModifiedLogScale which treated
values near (0, 1] very differently than what log does. This handles
negative value (wrong but data is presented) and sometimes present line
chart very nicely but it works against researchers' expectation.
Fixes #57