

Safe and readily available water is important for public health, whether it is used for drinking, domestic use, food production or recreational purposes. Better water supplies and sanitation, as well as better management of water resources, can contribute greatly to poverty reduction and economic growth. It is known that contaminated water and inadequate sanitation facilitate the transmission of diseases such as cholera, diarrhoea, dysentery, hepatitis A, typhoid, and polio. Those without access to clean water and sanitation face preventable health risks.
To understand what constitutes safe, potable water and distinguish between potable and non-potable water by applying machine learning techniques.

The dataset contains water quality metrics for 3276 different water bodies.
- ph: pH of water (0 to 14).
- Hardness: Capacity of water to precipitate soap in mg/L.
- Solids: Total dissolved solids in ppm.
- Chloramines: Amount of Chloramines in ppm.
- Sulfate: Amount of Sulfates dissolved in mg/L.
- Conductivity: Electrical conductivity of water in μS/cm.
- Organic_carbon: Amount of organic carbon in ppm.
- Trihalomethanes: Amount of Trihalomethanes in μg/L.
- Turbidity: Measure of light emitting property of water in NTU.
- Potability: Indicates if water is safe for human consumption. Potable - 1 and Not potable - 0
df=pd.read_csv('water_potability.csv')
If your notebook and csv files are in different places you can write the whole path to import the file.
df=pd.read_csv('../input/water-potability/water_potability.csv')
The data was highly imbalanced, hence we used Synthetic Minority Oversampling TEchnique, or SMOTE for short to balance the data.
SMOTE works by selecting examples that are close in the feature space, drawing a line between the examples in the feature space and drawing a new sample at a point along that line.Specifically, a random example from the minority class is first chosen. Then k of the nearest neighbours for that example is found (typically k=5).A randomly selected neighbour is chosen and a synthetic example is created at a randomly selected point between the two examples in feature space.
-
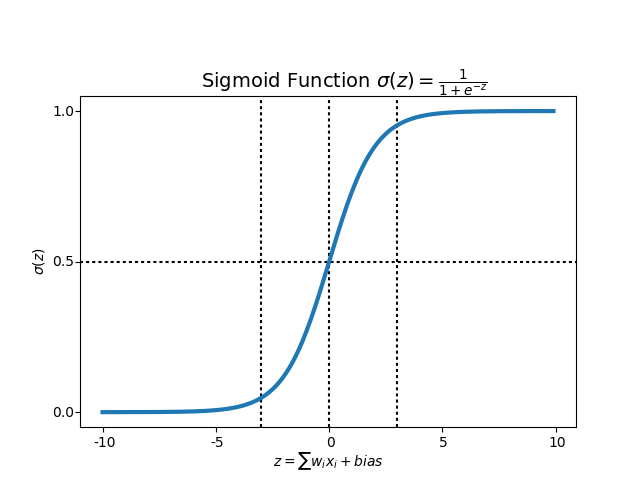
Logistic Regression - Logistic Regression is named for the function used at the core of the method, the logistic function.
The logistic function, also called the sigmoid function, was developed by statisticians to describe properties of population growth in ecology, rising quickly and maxing out at the carrying capacity of the environment. It’s an S-shaped curve that can take any real-valued number and map it into a value between 0 and 1, but never exactly at those limits.
-
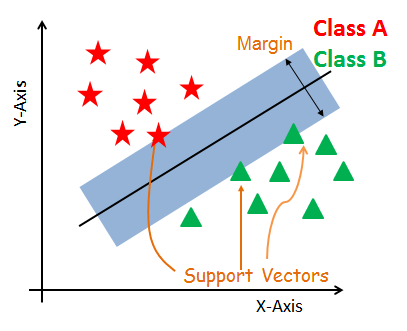
Support Vector Classifier - The objective of a Linear SVC (Support Vector Classifier) is to fit the data you provide, returning a "best fit" hyperplane that divides, or categorizes your data.
-
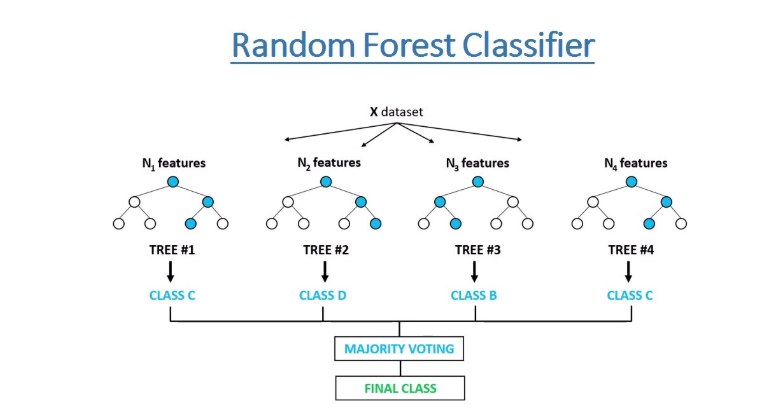
Random Forest Classifier - A random forest is a meta estimator that fits a number of decision tree classifiers on various sub-samples of the dataset and uses averaging to improve the predictive accuracy and control over-fitting.
- XGBoost - XGBoost is an optimized distributed gradient boosting library designed to be highly efficient, flexible and portable. It implements machine learning algorithms under the Gradient Boosting framework. XGBoost provides a parallel tree boosting (also known as GBDT, GBM).
The following python libraries were used to perform the various actions on the dataset from loading to preprocessing to visualizing and predicting the results.
import numpy as np
import pandas as pd
import matplotlib.pyplot as plt
import seaborn as sns
import plotly.express          as ex
import plotly.graph_objs       as go
import plotly.offline          as pyo
import scipy.stats             as stats
import pymc3                   as pm
import theano.tensor           as tt
Numpy- NumPy is the fundamental package needed for scientific computing with Python.
Pandas - Python library used to analyze data.
Matplotlib - Most of the Matplotlib utilities lies under the pyplot submodule.
Seaborn - An open-source Python library built on top of matplotlib. It is used for data visualization and exploratory data analysis.
Plotly - provides online graphing, analytics, and statistics tools for individuals and collaboration, as well as scientific graphing libraries for Python, R, MATLAB, Perl, Julia, Arduino, and REST.
Scikit-learn - tool for predictive data analysis built on numpy, scipy and matplotlib.
This project is under the MIT License. See LICENSE for Details.
- Siddharth RA1911003010117
- Evina RA1911003010104