A Python software solution for summarizing ridership statistics from bus routes. The program uses two Microsoft Excel workbooks as input and ouputs five summaries to an Excel workbook, each summary focusing on various statistics. This is a proprietary project, written for AJM & Associates LLC.
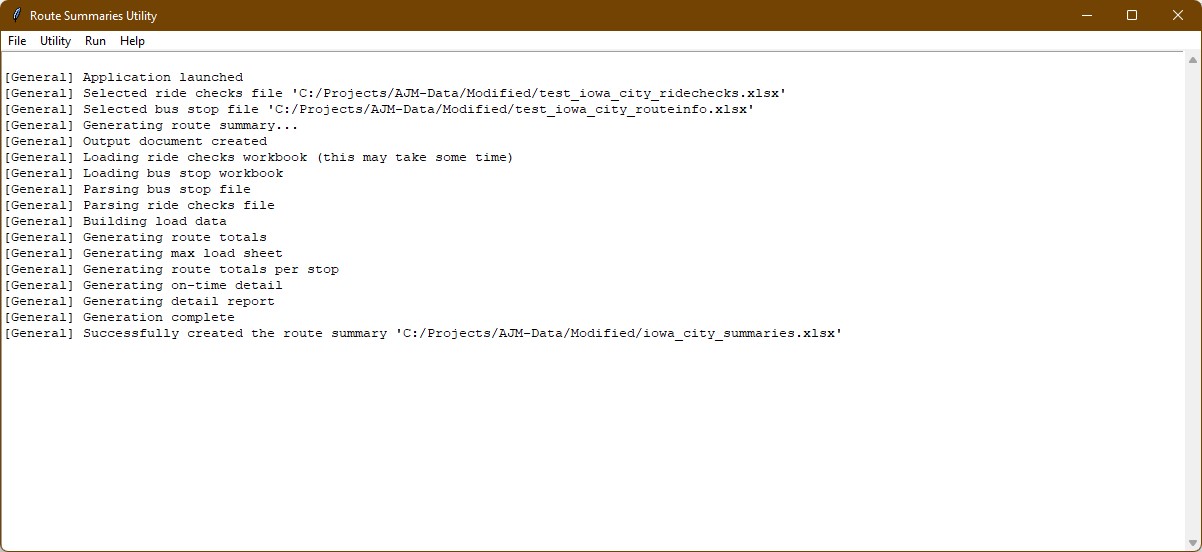
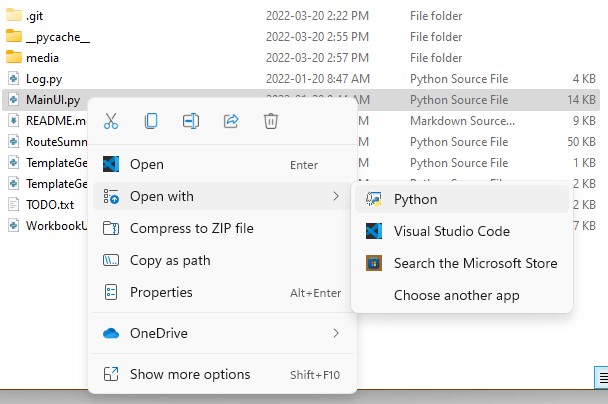
Launch the application by running the python script 'MainUI.py'.
Note that this program has the following dependencies:
- Python 3.9.5
- openpyxl - Install with 'pip install openpyxl'
- pywin - Install with 'pip install pywin32'
Route Summaries requires two Microsoft Excel workbook files as input to properly produce summaries: A ride checks data file and a bus stop file. Template files can be created through the program menu.
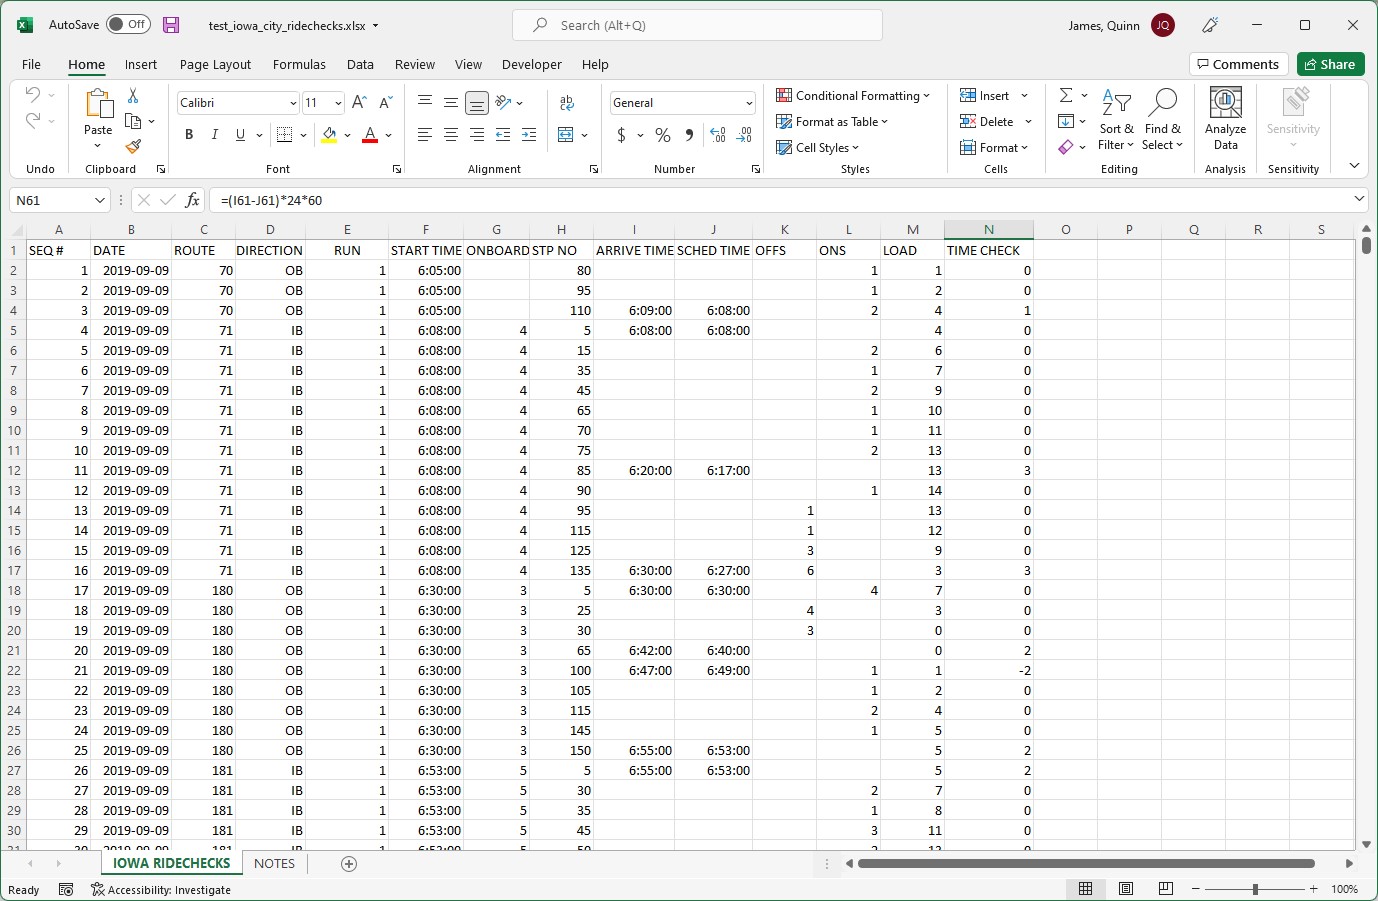
An MS-Excel workbook containing any number of rows with row 0 reserved for fixed headers. Each row contains the following columns of data, representing one ride check data entry:
- SEQUENCE
- Sequence number, the index of this ride check data entry. Numbers should be in order, with the first row (excel row 2) starting at sequence number 1. This number is for sorting convenience in the inital workbook and is not used for calculations.
- DATE
- An MS-Excel formatted date representing the date of data collection.
- ROUTE
- The route number of this ride check data entry.
- DIRECTION
- The direction of the route. Valid inputs are [IB, OB, NB, EB, SB, WB], representing the inbound busses, outbound busses, and the four cardial directions.
- RUN
- The run string for this route, a unique shift identifier for drivers. Typically formatted as a number.
- START TIME
- An MS-Excel formatted time representing the start time of the current route. This time should be consistent for all entries in a given date, route, direction, run combination.
- ONBOARD
- The number of passengers carried over from a previous route on a given run if the number of passengers on board is above 0. Should be the same for all stops on one route with the same start date & time.
- STOP NUMBER
- The bus stop number of this stop. Stops where no passengers depart or board may optionally be ommited.
- ARRIVAL TIME (Optional)
- The actual arrival time for this ride check data entry. May be left blank if SCHEDULE TIME is also left blank. An MS-Excel formatted time.
- SCHEDULE TIME (Optional)
- The scheduled arrival time for this ride check data entry. An MS-Excel formatted time.
- OFFS (Optional)
- The number of passengers departing the bus at this stop. Blank cells will be interpreted as 0.
- ONS (Optional)
- The number of passengers boarding the bus at this stop. Blank cells will be interpreted as 0.
- LOADS (Optional)
- The number of passengers on the bus after this stop. This row is not used for program data but may be filled in for manual reference.
- TIME CHECK (Optional)
- The difference between the ARRIVAL TIME and the SCHEDULE TIME for this stop. This row is not used for program data but may be filled in for manual reference.
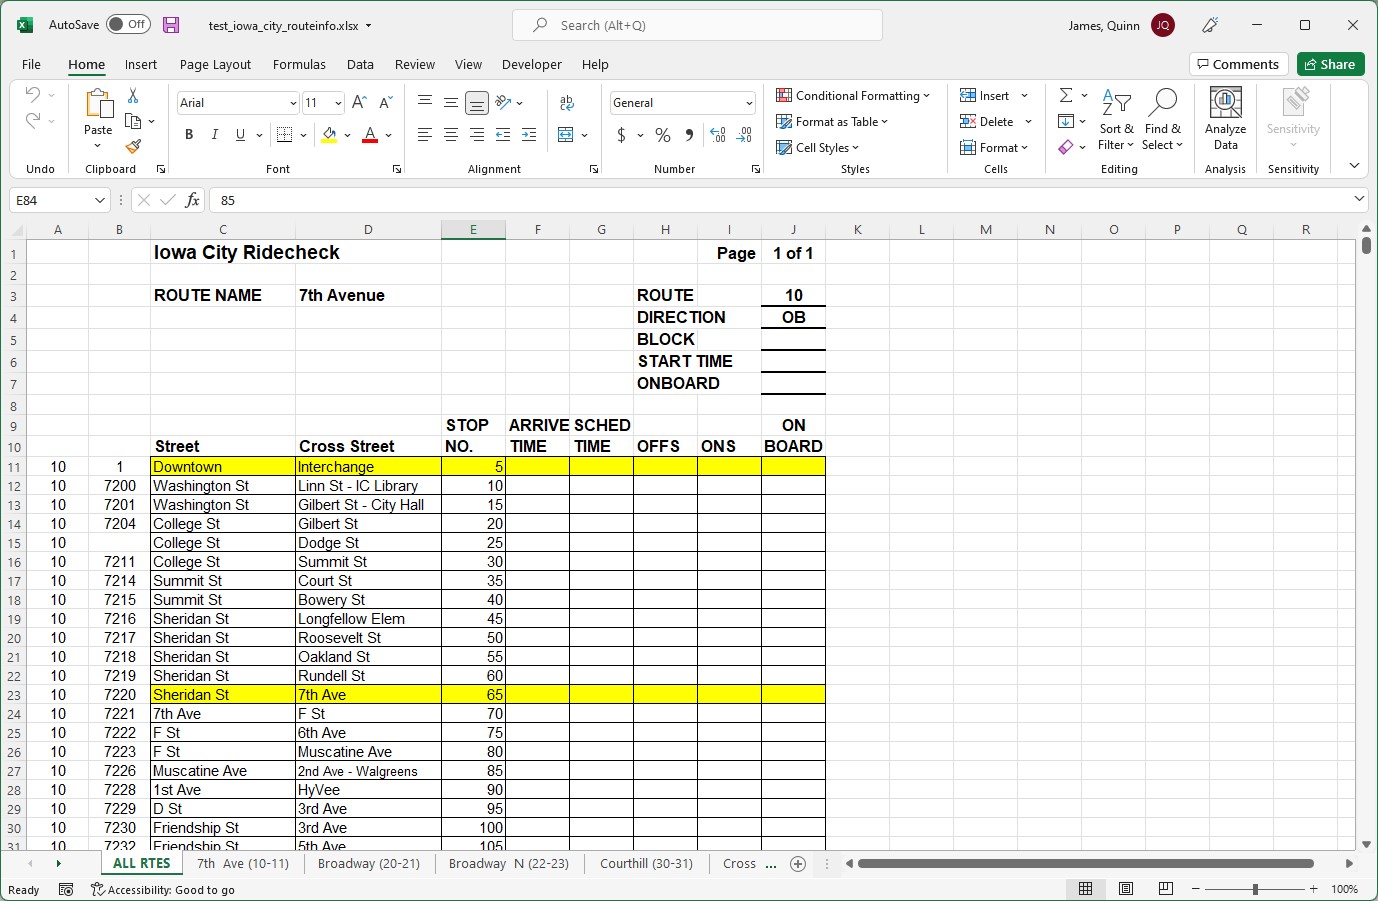
An MS-Excel workbook containing one sheet which represents a ROUTE-DIRECTION combination of the form 'Rte #D' where # is the ROUTE and D is the DIRECTION as defined above in the Ride Checks Data File section.
The sheet may contain an unlimited number of column-aligned tables on arbitrary rows. The following information is required for each table header:
-
ROUTE
- The route number of this table
-
DIRECTION
- The direction of the route. Valid inputs are [IB, OB, NB, EB, SB, WB, LP], representing the inbound busses, outbound busses, and the four cardial directions.
Additionally, each row of the table represents a stop on this route. Each row must be populated with the following columns:
- STREET
- The name of the main street of this stop. This name is flexible depending on the naming convention of the bus route.
- CROSS STREET
- The name of the cross street of this stop. This name is flexible depending on the naming convention of the bus route.
- NO
- The stop number for this route. Columns must be in numberical order from top to bottom.
Rows containing fill information (such as colored cells) will be interpreted as timed stops for outputs such as the On Time Detail. To mark stops as timed, color columns C-J for each stop.
The name of the project will be scraped from column C in the first header of the first table. This project name will be used occasionally across the output workbooks. For example, if the project is taking place in Iowa City, consider filling in this table with 'Iowa City'.
All other data in this workbook may be left blank.
Route Summaries outputs an MS-Excel workbook containing seven sheets displaying various summaries. Descriptions of the outputs are detialed below:
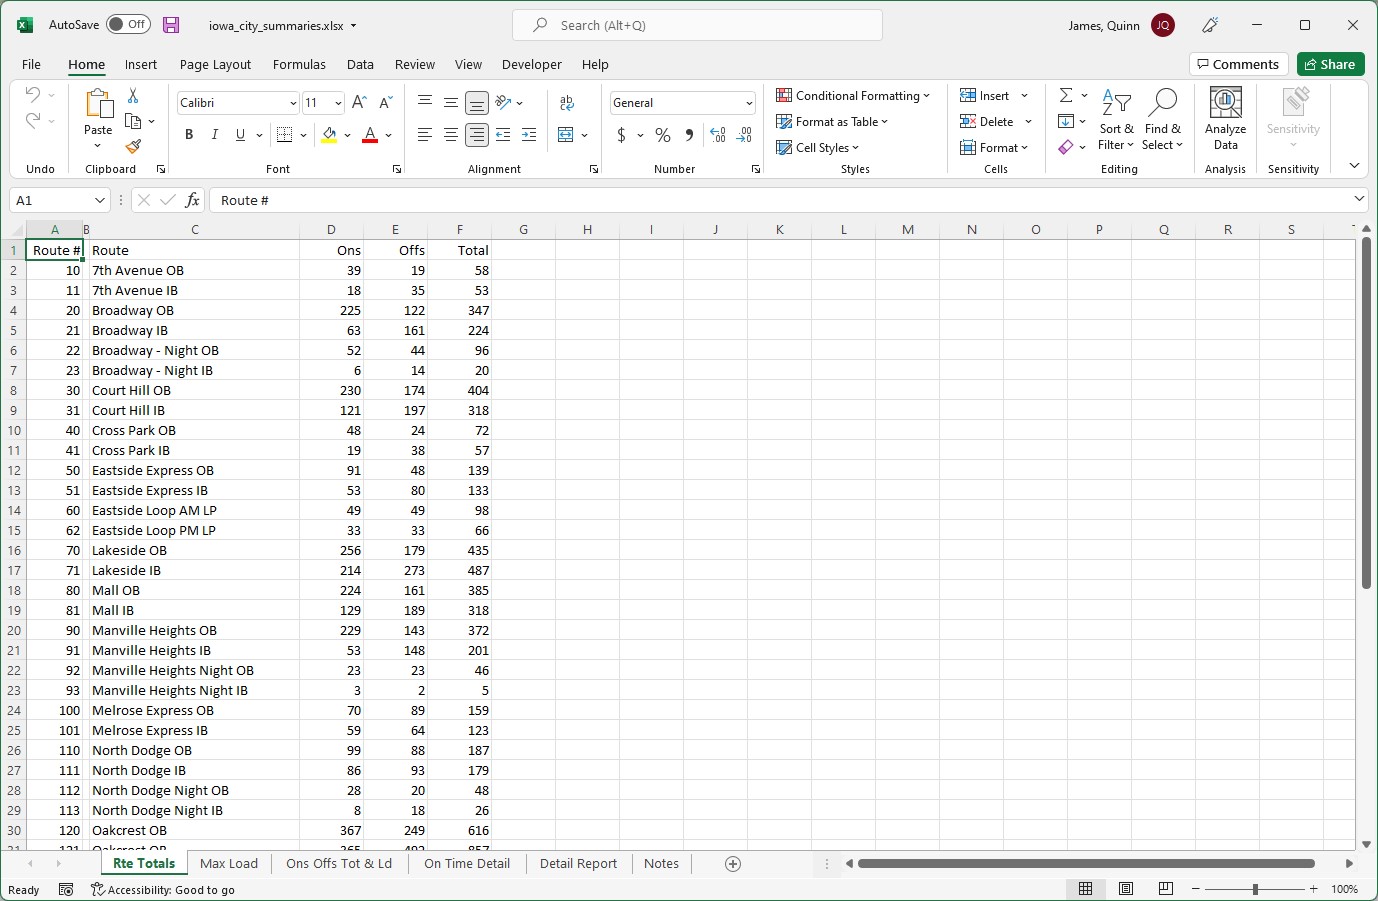
A sheet which shows the passenger totals for each route / direction combination. Formatted as rows of totals, each column representing the following:
- Route #.
- This line's route number.
- Route
- A descriptor of this route. Example: University OB
- Ons
- The total number of boarded passengers across all recorded runs.
- Offs
- The total number of departed passengers across all recorded runs.
- Total
- The total of the boarded and departed passenger counts across all recorded runs.
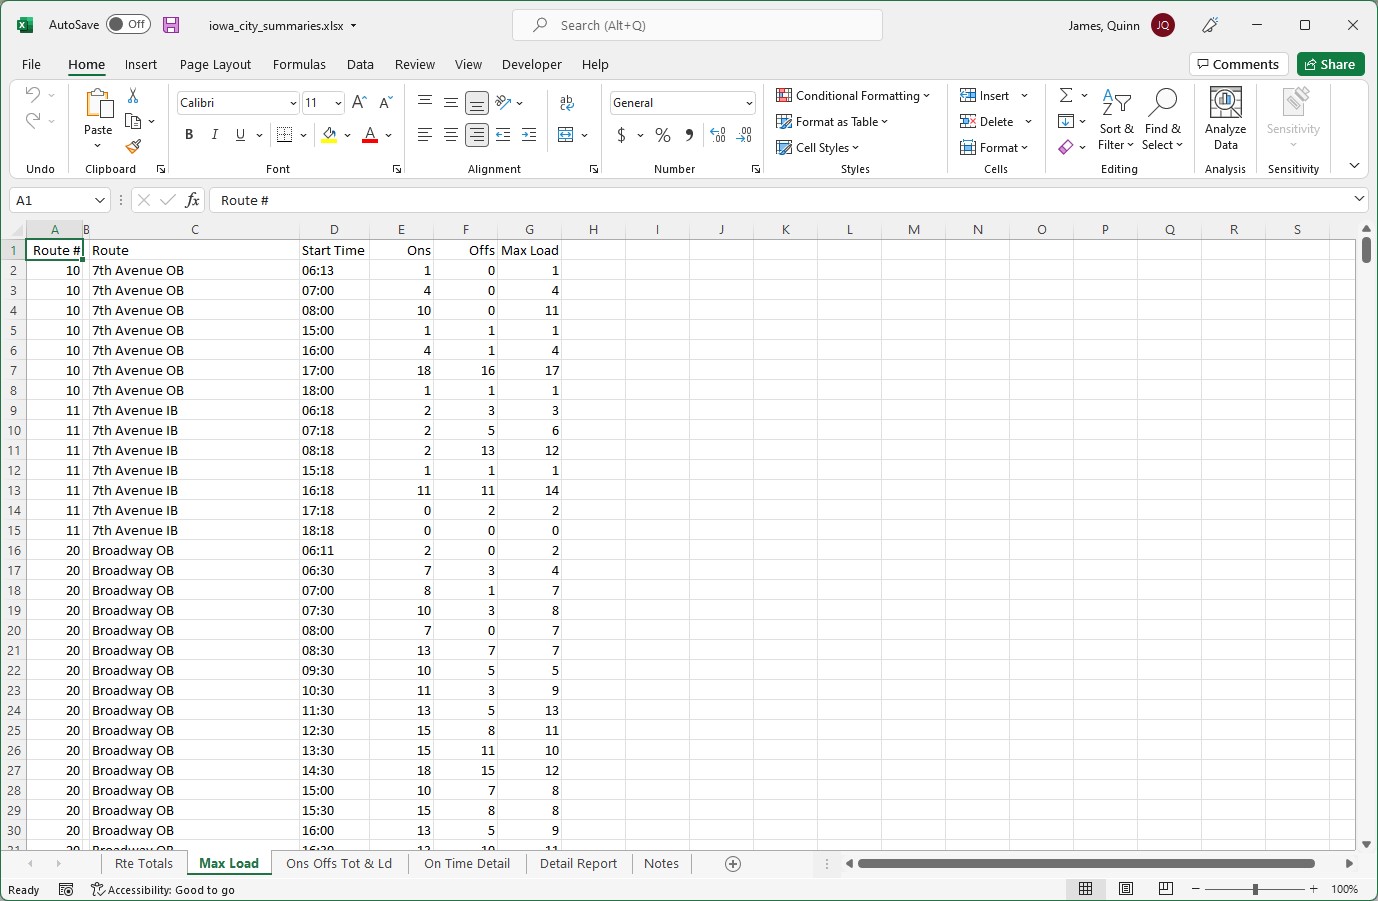
A sheet which shows the maximum number of passengers on a given route over time. Data is formatted as rows, each column representing the following:
- Route #.
- This line's route number.
- Route
- A descriptor of this route. Example: University OB
- Start Time
- An MS-Excel formatted time representing the start time of this run.
- Ons
- The total number of boarded passengers for all stops during this run.
- Offs
- The total number of departed passengers for all stops during this run.
- Max Load
- The maximum number of passengers on a bus for all stops during this run.
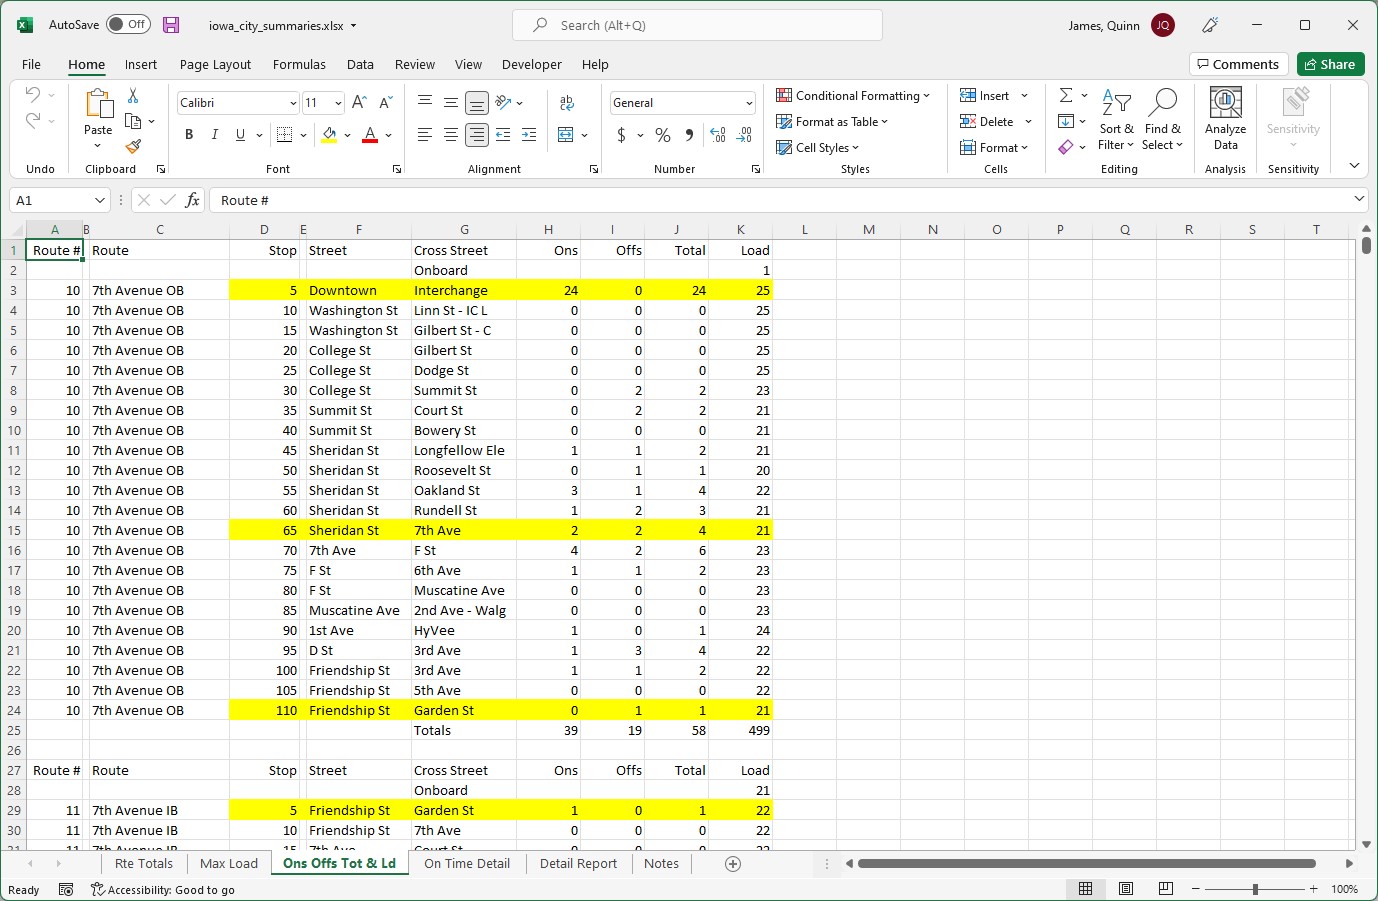
A sheet which displays totals for each stop on each route. Data is output in rows, each column representing the following:
- Route #.
- This line's route number.
- Route
- A descriptor of this route. Example: University OB
- Stop No.
- The stop number of this stop.
- Street
- The name of the main street of this stop.
- Cross Street
- The name of the cross street of this stop.
- Ons
- The total number of boarding passengers over all trips at this stop.
- Offs
- The total number of departing passengers over all trips at this stop.
- Total
- The total number of boarding and departing passengers over all trips at this stop.
- Load
- The total number of passengers onboard the bus after this stop.
Each route is prefaced by a row titled 'ONBOARD'. This row represents the total passengers being carried over from a previous route. Following the route, a row sums all data columns to provide data across all stops. Rows containing timed stops will be shaded yellow.
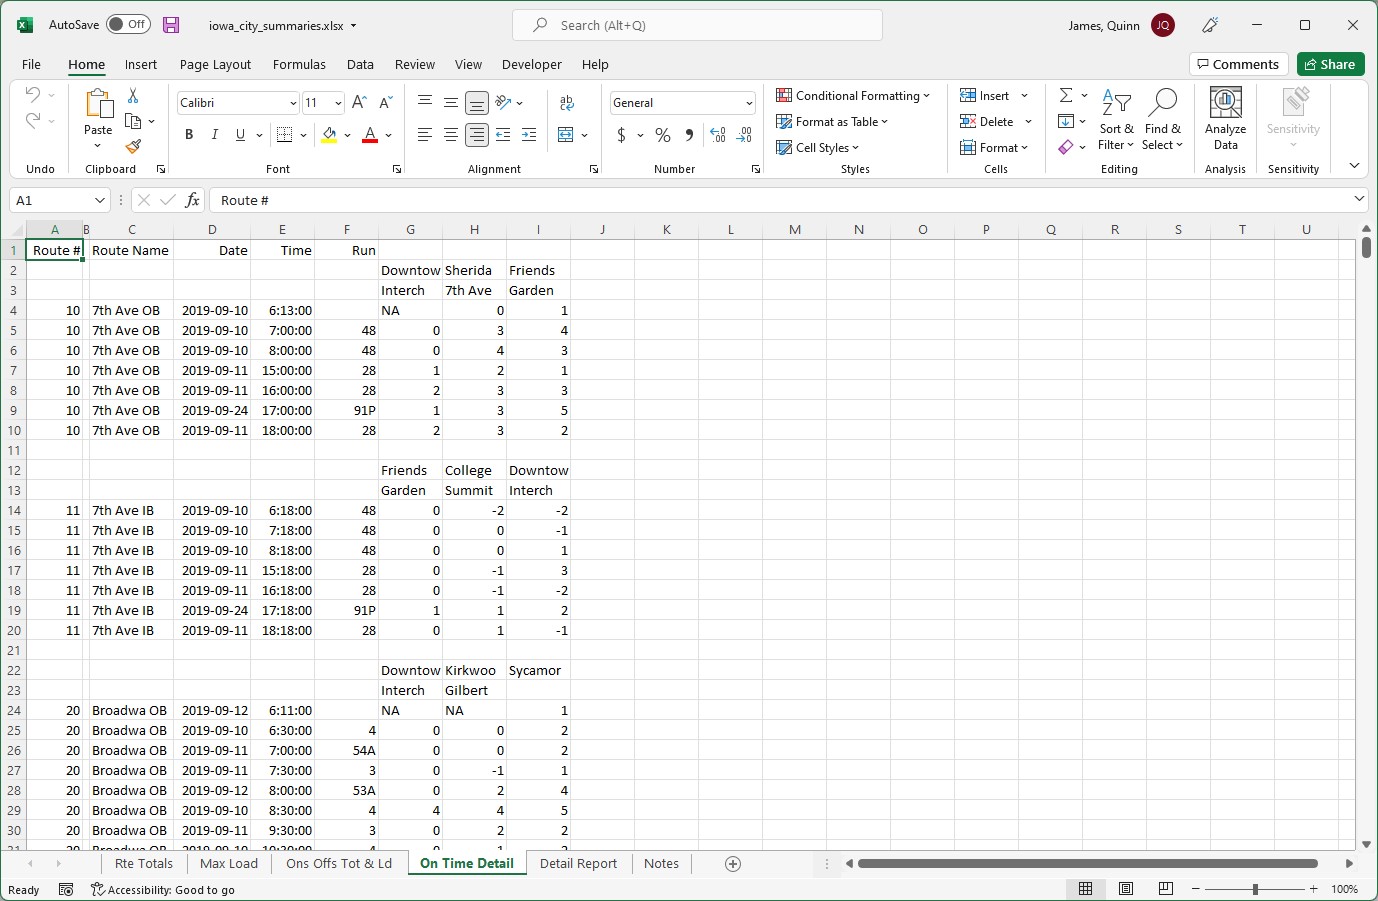
A sheet which shows bus routes that arrive on-time or behind schedule. Data is diplayed for each timed stop for each route for each scheduled route start time. Each column represents the following:
- Route #.
- This line's route number.
- Route
- A descriptor of this route. Example: University OB
- Date
- An MS-Excel formatted data representing the start date of this run.
- Time
- An MS-Excel formatted data representing the start time of this run.
- Run
- The run string for this route, a unique shift identifier for drivers.
- Timed columns
- Columns beyond column F represent timed stops on the current route. Headers of "Sherida" and "7th Ave" represent a stop at the intersection of Sherida and 7th. For each row, an integer represents how many minutes behind schedule a bus ran. Negative numbers indicate a bus arrived ahead of schedule.
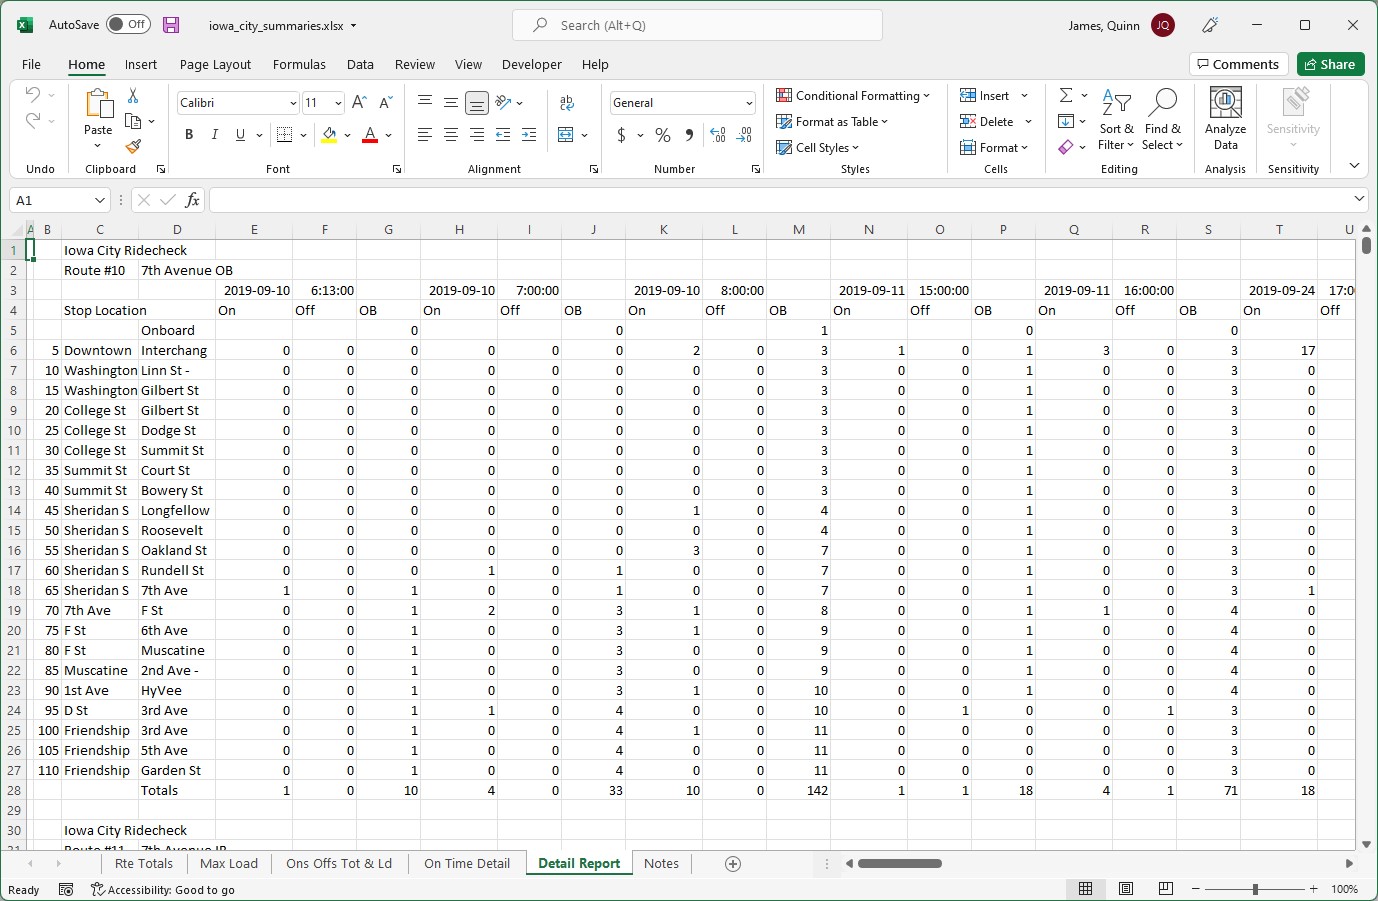
A sheet which shows boardings, departures, and carryover passengers for each stop for each route over the course of a day. This sheet contains many tables, each representing a different route. Rows in these tables represent stops along the route, with columns representing various run times for the route. Individual cells represent customers boarding, departing, or remaining on the bus. A row along the bottom displays customer totals for each run time.
An additional sheet used to detail operational details which may affect the collected data. This data is manually added after workbook generation.
This project is proprietary. Copyright 2021-2022 by AJM & Associates LLC.