![]()

![]()
Read, write and manipulate dfs0, dfs1, dfs2, dfs3, dfsu and mesh files. Read res1d and xns11 files.
Facilitates common data processing workflows for MIKE files.
- Windows operating system
- Python x64 3.6, 3.7 or 3.8
- VC++ redistributables (already installed if you have MIKE)
The latest version of mikeio (v 0.5), has a lot of new functionality, but also several breaking changes to the API !! It was released on 2020-09-03.
From PyPI:
pip install mikeio
Or development version:
pip install https://github.com/DHI/mikeio/archive/master.zip
Generic read method to read values, if you need additional features such as coordinates, use specialised classes instead e.g. Dfsu
>>> import mikeio
>>> ds = mikeio.read("random.dfs0")
>>> ds
<mikeio.DataSet>
Dimensions: (1000,)
Time: 2017-01-01 00:00:00 - 2017-07-28 03:00:00
Items:
  0:  VarFun01 <Water Level> (meter)
  1:  NotFun <Water Level> (meter)
>>> ds = mikeio.read("random.dfs1")
>>> ds
<mikeio.DataSet>
Dimensions: (100, 3)
Time: 2012-01-01 00:00:00 - 2012-01-01 00:19:48
Items:
0: testing water level <Water Level> (meter)>>> from mikeio import Dfs0
>>> dfs = Dfs0('simple.dfs0')
>>> ts = dfs.to_dataframe()>>> from datetime import datetime
>>> import numpy as np
>>> from mikeio import Dfs0
>>> data = [np.random.random([100])]
>>> dfs = Dfs0()
>>> dfs.write('simple.dfs0', data, start_time=datetime(2017, 1, 1), dt=60)import pandas as pd
import mikeio
>>> df = pd.read_csv(
... "tests/testdata/co2-mm-mlo.csv",
... parse_dates=True,
... index_col="Date",
... na_values=-99.99,
... )
>>> df.to_dfs0("mauna_loa.dfs0")For more examples on timeseries data see this notebook
>>>  from mikeio import Dfs2
>>> dfs = Dfs2("random.dfs2")
>>> ds = dfs.read()
>>> ds
<mikeio.DataSet>
Dimensions: (3, 100, 2)
Time: 2012-01-01 00:00:00 - 2012-01-01 00:00:24
Items:
0: testing water level <Water Level> (meter)For a complete example of conversion from netcdf to dfs2 see this notebook.
Another example of downloading meteorological forecast from the Global Forecasting System and converting it to a dfs2 ready to be used by a MIKE 21 model.
>>>  from mikeio import res1d
>>>  # Query the discharge time series at chainage 10.1 of branch1
>>>  q1 = res1d.QueryData('Discharge', 'branch1', 10.1)
>>>  # Query all the discharge time series of branch2
>>>  q2 = res1d.QueryData('Discharge', 'branch2')
>>>  # Query all the water level time series in the file
>>>  q3 = res1d.QueryData('WaterLevel')
>>>  # Combine the queries in a list
>>>  queries = [q1, q2, q3]
>>>  # The returned ts object is a pandas DataFrame
>>>  ts = res1d.read('res1dfile.res1d', queries)
For more examples on Res1D see this notebook
>>>  import matplotlib.pyplot as plt
>>>  from mikeio import xns11
>>>  # Query the geometry of chainage 58.68 of topoid1 at reach1
>>>  q1 = xns11.QueryData('topoid1', 'reach1', 58.68)
>>>  # Query the geometry of all chainages of topoid1 at reach2
>>>  q2 = xns11.QueryData('topoid1', 'reach2')
>>>  # Query the geometry of all chainages of topoid2
>>>  q3 = xns11.QueryData('topoid2')
>>>  # Combine the queries in a list
>>>  queries = [q1, q2, q3]
>>>  # The returned geometry object is a pandas DataFrame
>>>  geometry = xns11.read('xsections.xns11', queries)
>>>  # Plot geometry of chainage 58.68 of topoid1 at reach1
>>>  plt.plot(geometry['x topoid1 reach1 58.68'],geometry['z topoid1 reach1 58.68'])
>>>  plt.xlabel('Horizontal [meter]')
>>>  plt.ylabel('Elevation [meter]')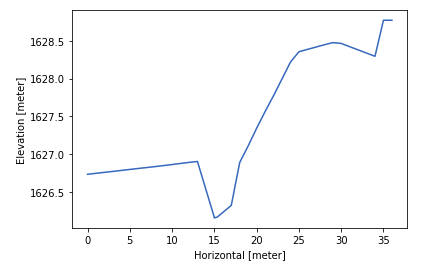
>>>  import matplotlib.pyplot as plt
>>>  from mikeio import Dfsu
>>>  dfs = Dfsu("HD.dfsu")
>>>  ds = dfs.read()
>>>  idx = dfs.find_nearest_element(x=608000, y=6907000)
>>>  plt.plot(ds.time, ds.data[0][:,idx])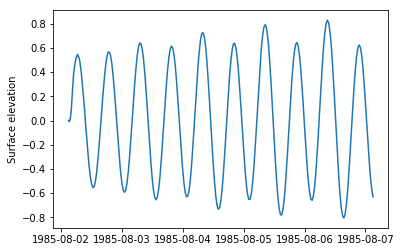
For more examples on working with dfsu see these notebooks:
Useful when creating a new dfs file
>>> from mikeio.eum import EUMType, EUMUnit
>>> EUMType.Temperature
<EUMType.Temperature: 100006>
>>> EUMType.Temperature.units
[degree Celsius, degree Fahrenheit, degree Kelvin]
>>> EUMUnit.degree_Kelvin
degree KelvinMIKE IO is tested extensively. 93% total test coverage.
See detailed test coverage report below:
----------- coverage: platform win32, python 3.7.4-final-0 -----------
Name                     Stmts   Miss  Cover
--------------------------------------------
mikeio\__init__.py          33      1    97%
mikeio\aggregator.py       104      9    91%
mikeio\dfs.py               75      5    93%
mikeio\dfs0.py             186     34    82%
mikeio\dfs1.py              75      5    93%
mikeio\dfs2.py             118     10    92%
mikeio\dfs3.py             160     78    51%
mikeio\dfs_util.py          40     14    65%
mikeio\dfsu.py             815     55    93%
mikeio\dotnet.py            63      4    94%
mikeio\dutil.py            117      7    94%
mikeio\eum.py             1196      2    99%
mikeio\generic.py          126      1    99%
mikeio\helpers.py            6      0   100%
mikeio\res1d.py            202      7    97%
mikeio\spatial.py           31     11    65%
mikeio\xns11.py            199      6    97%
--------------------------------------------
TOTAL                     3546    249    93%

========================================== 199 passed ==================