This repo demonstrates how to easily overlay community polygons on forest cover data and make a beautiful map using R and ggplot2.
The R code helps you overlay community spatial polygons over forest cover satellite imagery to compute and map the average percentage of the land area under forest using no more than 200 lines of code.
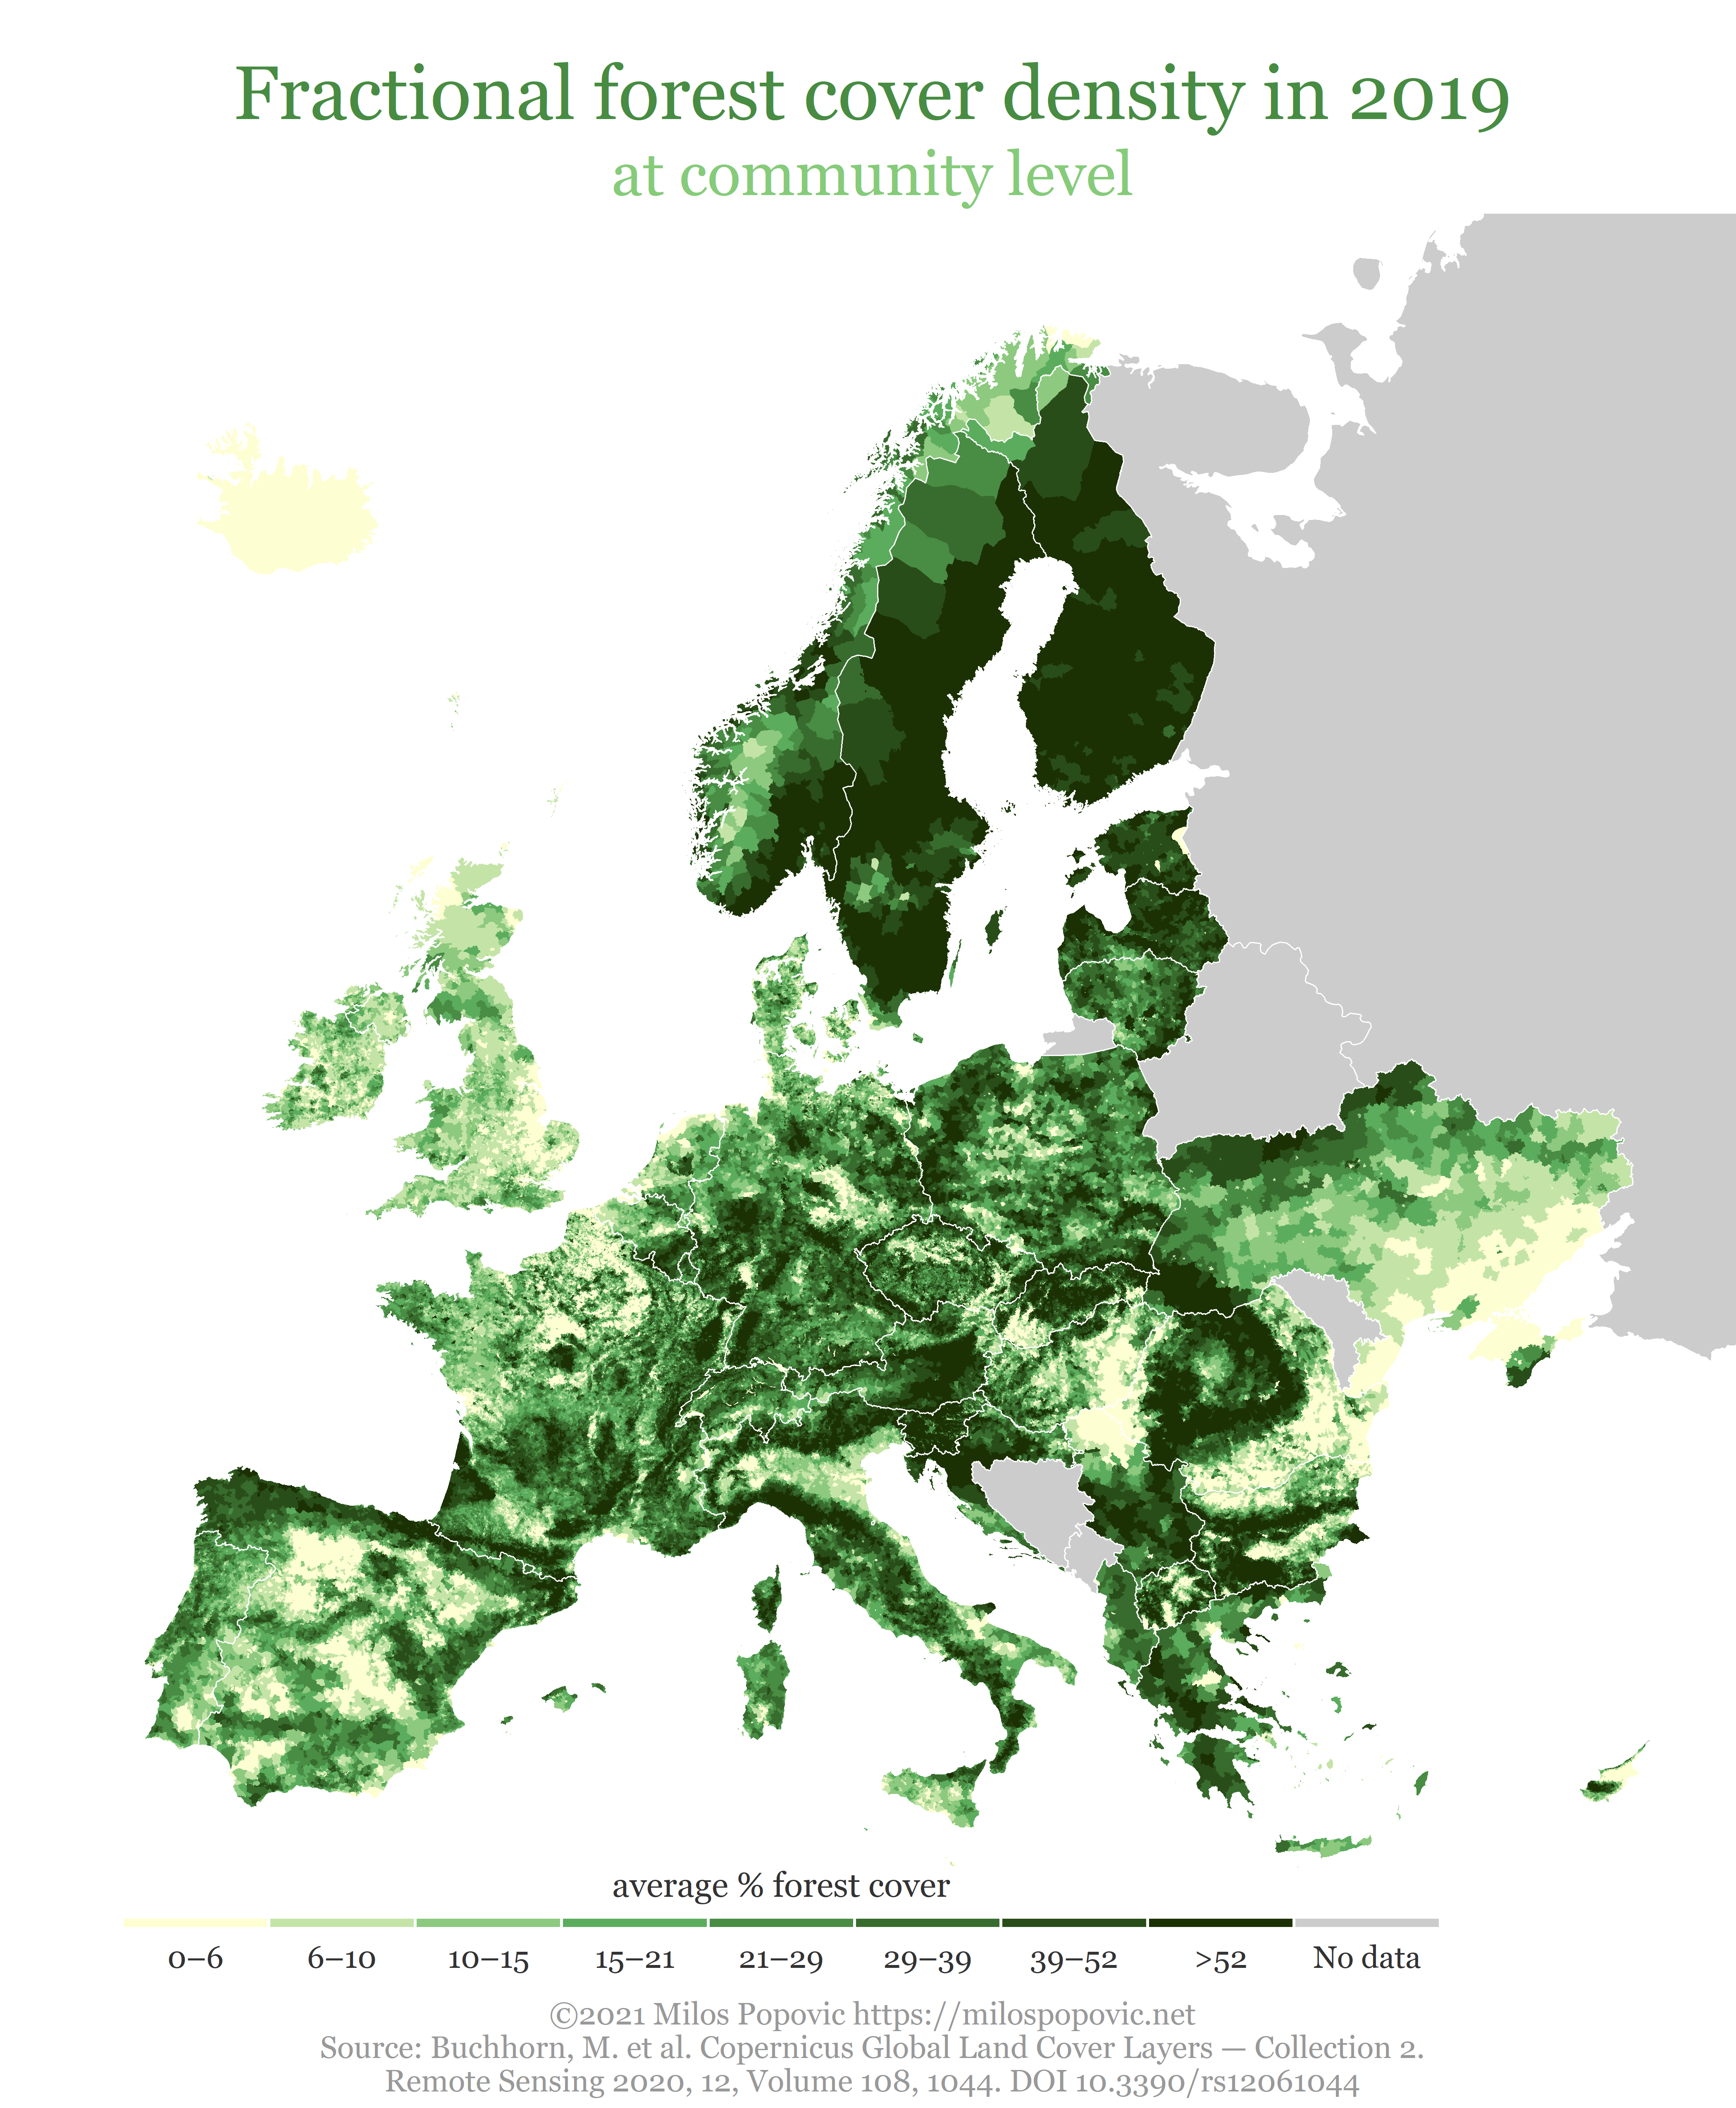
The data on fractional forest cover from Global Land Cover of the Copernicus Monitoring Services. The shapefile of over 122,000 communities in Europe comes from Eurostat's GISCO repo. The code overlay this shapefile on the forest cover data using function exact_extract from library exactextract to compute the average value of each forest cover cell that intersects the community polygons, weighted by the percent of the cell that is covered. This will yield the average percentage of the forest cover for a specific community.