
Welcome to Bit Project's Introduction to Data Science. This is an exciting step we will be taking into understanding the world of digital data and how to use and analyze it.
Before we get started, first let's dive into exactly what this course is:
The first class of the week consists of discussion and research about related topics that vary from historical to recently recorded datasets.
The second class of the week is meant to help prepare for these discussions. This portion of the course marks the connection between Bit Project and Howard University's student leaders, bonding over teaching modern analytical thinking and programming tools.


- Python and Numpy
- Pandas for DataFrame Processing
- Matplotlib for simple visualizations
There are 4 Tutorials in this course. These tutorials will focus on helping you understand the tools used for working with and analyzing data. This analysis will range from beginner-friendly to intuition based-visualizations.
Every week, you will learn a new tool and how to use it effectively. We will do this by following a "building blocks" method of thinking, in which every topic will add as a step towards the end of a data processing pipeline.
You can reinforce your knowledge by working on graded 'Now Try This' exercises that are included in every tutorial notebook.
Additionally, you will also have access to homework for the 4 Tutorials, similar to the 'Now Try This' sections.
By the last tutorial, you will be ready and equipped with the complete resources to work through a dataset by utilizing the following skills:
- Understand Python base/built-in methods to work with data.
- Convert data into a table (aka DataFrame) format and clean/filter to identify meaningful data.
- Visualize numerical data and find simple patterns.
- Visualize categorical data and perform statistical analysis to draw your own conclusions.
- Understand the concept of data modeling.
There is an open-ended final project for this course. All students will be encouraged to work on a dataset of their choosing or one provided in the prior weeks to answer a question they have, argue for a finding or conclusion they've drawn, or begin a research proposal.
We believe analyzing data backs up claims extremely well, and it is often the basis for bigger discoveries. Code wins arguments, and you can write that winning code. More on this in future weeks, though!
There’s a joke that says a data scientist is someone who knows more statistics than a computer scientist and more computer science than a statistician. (I didn’t say it was a good joke.) In fact, some data scientists are — for all practical purposes — statisticians, while others are fairly indistinguishable from software engineers. Some are machine learning experts, while others couldn’t machine-learn their way out of kindergarten. Some are PhDs with impressive publication records, while others have never needed to read an academic paper. In short, pretty much however you define data science, you’ll find practitioners for whom the definition is totally, absolutely wrong.
Nonetheless, we won’t let that stop us from trying. We’ll say that a data scientist is someone who extracts insights from messy data. Today’s world is full of people trying to turn data into insight. Some study cases are:
- The dating site OkCupid asks its members to answer thousands of questions to find the most appropriate matches for them. But it also analyzes these results to figure out innocuous-sounding questions you can ask someone to find out how likely someone is to sleep with you on the first date.
- Facebook asks you to list your hometown and your current location, ostensibly to make it easier for your friends to find and connect with you. But it also analyzes these locations to identify global migration patterns and where the fanbases of different football teams live.
- As a large retailer, Target tracks your purchases and interactions, both online and in-store. And it uses the data to predictively model which of its customers are pregnant, to better market baby-related purchases to them.
- In 2012, the Obama campaign employed dozens of data scientists who data-mined and experimented their way to identifying voters who needed extra attention, choosing optimal donor-specific fundraising appeals and programs, and focusing get-out-the-vote efforts where they were most likely to be useful. And in 2016 the Trump campaign tested a staggering variety of online ads and analyzed the data to find what worked and what didn’t.
One of the main subsets of Data Science is Data Analytics
Data analytics is the science of analyzing raw data to make conclusions about that information. Many of the techniques and processes of data analytics have been automated into mechanical processes and algorithms that work over raw data for human consumption.
Data analytics techniques can reveal trends and metrics that would otherwise be lost in the mass of information. This information can then be used to optimize processes to increase the overall efficiency of a business or system.
Without data analysis, we wouldn't be able to advance as fast to the point where were are today. The reason a field such as data analysis is so important is that, in many cases, we should conclude based on our own intuition. This is particularly because of our innate ability to simplify complex patterns to be able to comprehend them.
One known example is of John Snow (Not the Game of Thrones character)
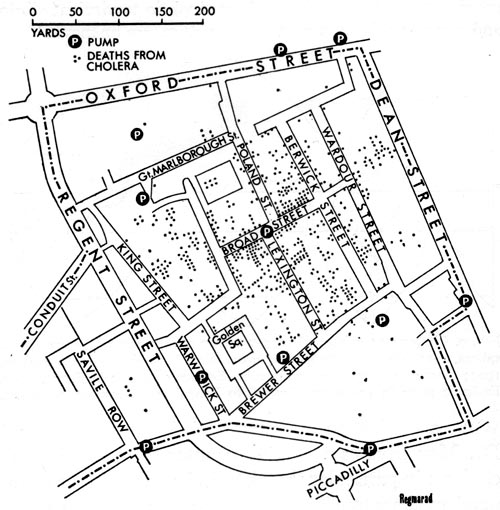
John Snow was a British doctor who used data collection and data analysis to trace the source of a cholera outbreak in central London, and to come to the conclusion that cholera was transmitted by “an agent in the water” than by the accepted theory that it was transmitted by “bad air”.
Snow used data collection to trace the cholera outbreak to two water companies who drew their water from the Thames river, virtually unfiltered. He notes that a huge, double-blind experiment fell into his lap: “No fewer than three hundred thousand people of both sexes, of every age and occupation, and of every rank and station, from the most rich down to the very poor, were divided into two groups without their choice, and, in most cases, without their knowledge; one group being supplied water containing the sewage of London, and amongst it, whatever might have come from the cholera patients, the other group having water quite free from such impurity.”
Snow’s analysis of the subsequent data and his other works led to fundamental changes in water and waste management in London and other cities, saving many lives and contributing significantly to global public health.
Data analytics is broken down into four basic types.
Descriptive analytics describes what has happened over a given time. Have the number of views gone up? Are sales stronger this month than last?
Diagnostic analytics focuses more on why something happened. This involves more diverse data inputs and a bit of hypothesizing. Did the weather affect beer sales? Did that latest marketing campaign impact sales?
Predictive analytics moves to what is likely going to happen in the near term. What happened to sales the last time we had a hot summer? How many weather models predict a hot summer this year?
Prescriptive analytics suggests a course of action. If the likelihood of a hot summer is measured as an average of these five weather models is above 58%, we should add an evening shift to the brewery and rent an additional tank to increase output.
| OSEMN Pipeline | |
|---|---|
| O | Obtaining our data |
| S | Scrubbing / Cleaning our data |
| E | Exploring / Visualizing our data will allow us to find patterns and trends |
| M | Modeling our data will give us our predictive power as a wizard |
| N | Interpreting our data |
The first step is to determine the data requirements or how the data is grouped. Data may be separated by age, demographic, income, or gender. Data values may be numerical or be divided by category. The second step in data analytics is the process of collecting it. This can be done through a variety of sources such as computers, online sources, cameras, environmental sources, or from personnel. Once the data is collected, it must be organized so it can be analyzed. Organization may take place on a spreadsheet or other form of software that can take statistical data. The data is then cleaned up before analysis. This means it is scrubbed and checked to ensure there is no duplication or error, and that it is not incomplete. This step helps correct any errors before it goes on to a data analyst to be analyzed.
The instructional material for this course is hosted entirely online via Google Colab Jupyter Notebooks. Because of this, students will not need to install or download anything for their local system, which makes this course very easily accessible.
Each week, students will be given a link to access the assigned learning material, which consists of a Google Colab Tutorial as well as the course-curated dataset for the week. The tutorials contain all of the learning material as well as guided practice for students to apply their newly learned skills.
The entire set of the curriculum here is currently hosted on Bit Project’s GitHub page. Each week features a different tutorial as labeled with the “.ipynb” file extension. To access the Google Colab Tutorials, students can click on the blue “Open in Colab” button at the top of the tutorial’s content section.

This will redirect to the Google Colab Jupyter Notebook environment that allows students to interact with the material and the provided exercises.

Within this environment, students can read through the learning content, and interact with the material by running the code provided. (To execute lines of code, students can either press the PLAY button on the left-hand side of the code block, or press SHIFT + ENTER.)
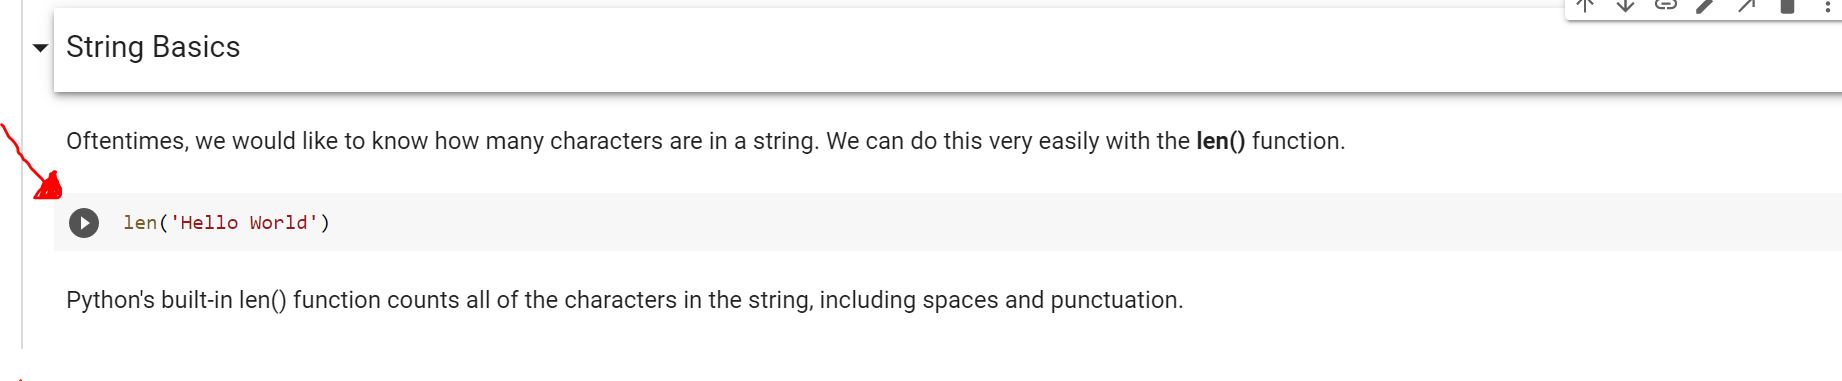
The output for the executed code will appear underneath the code block.

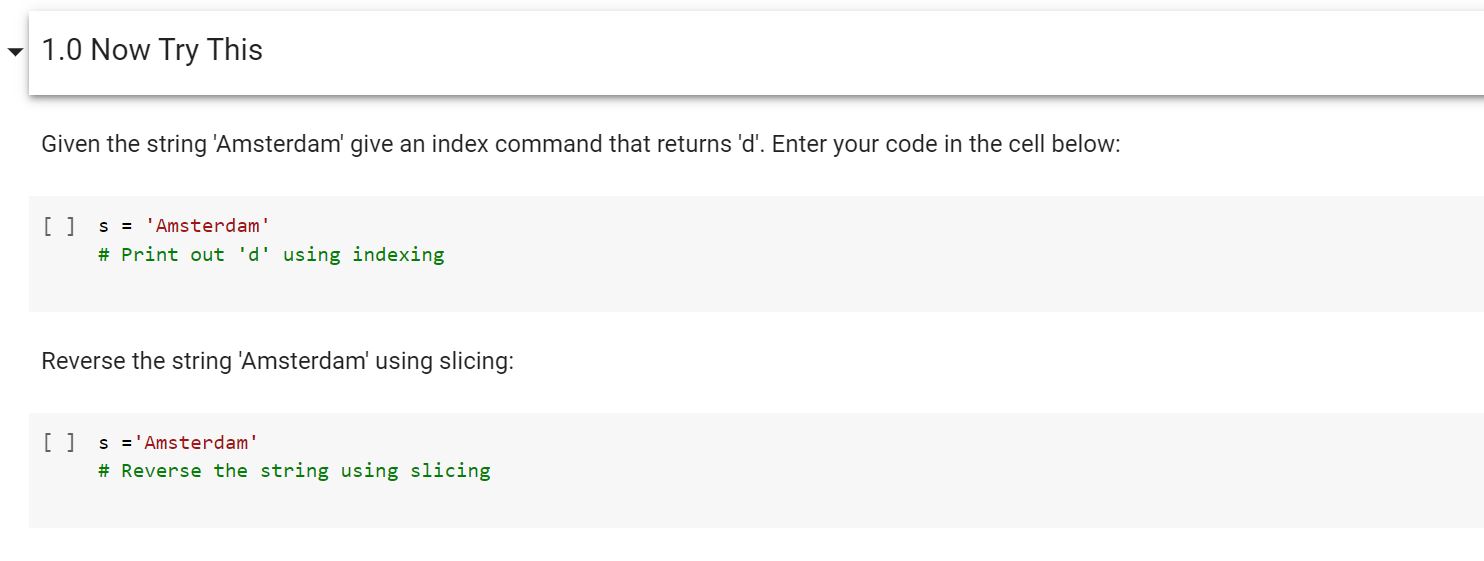
The tutorials also feature “Now Try This” sections that allow students the opportunity to practice applying their newly learned skills. The solutions can also be provided for these exercises.
To save and download your notebook, follow the steps in the image below
