✨ Data Science Pipelines. Beautifully Designed ✨
Live Demo: https://demo.kedro.org/


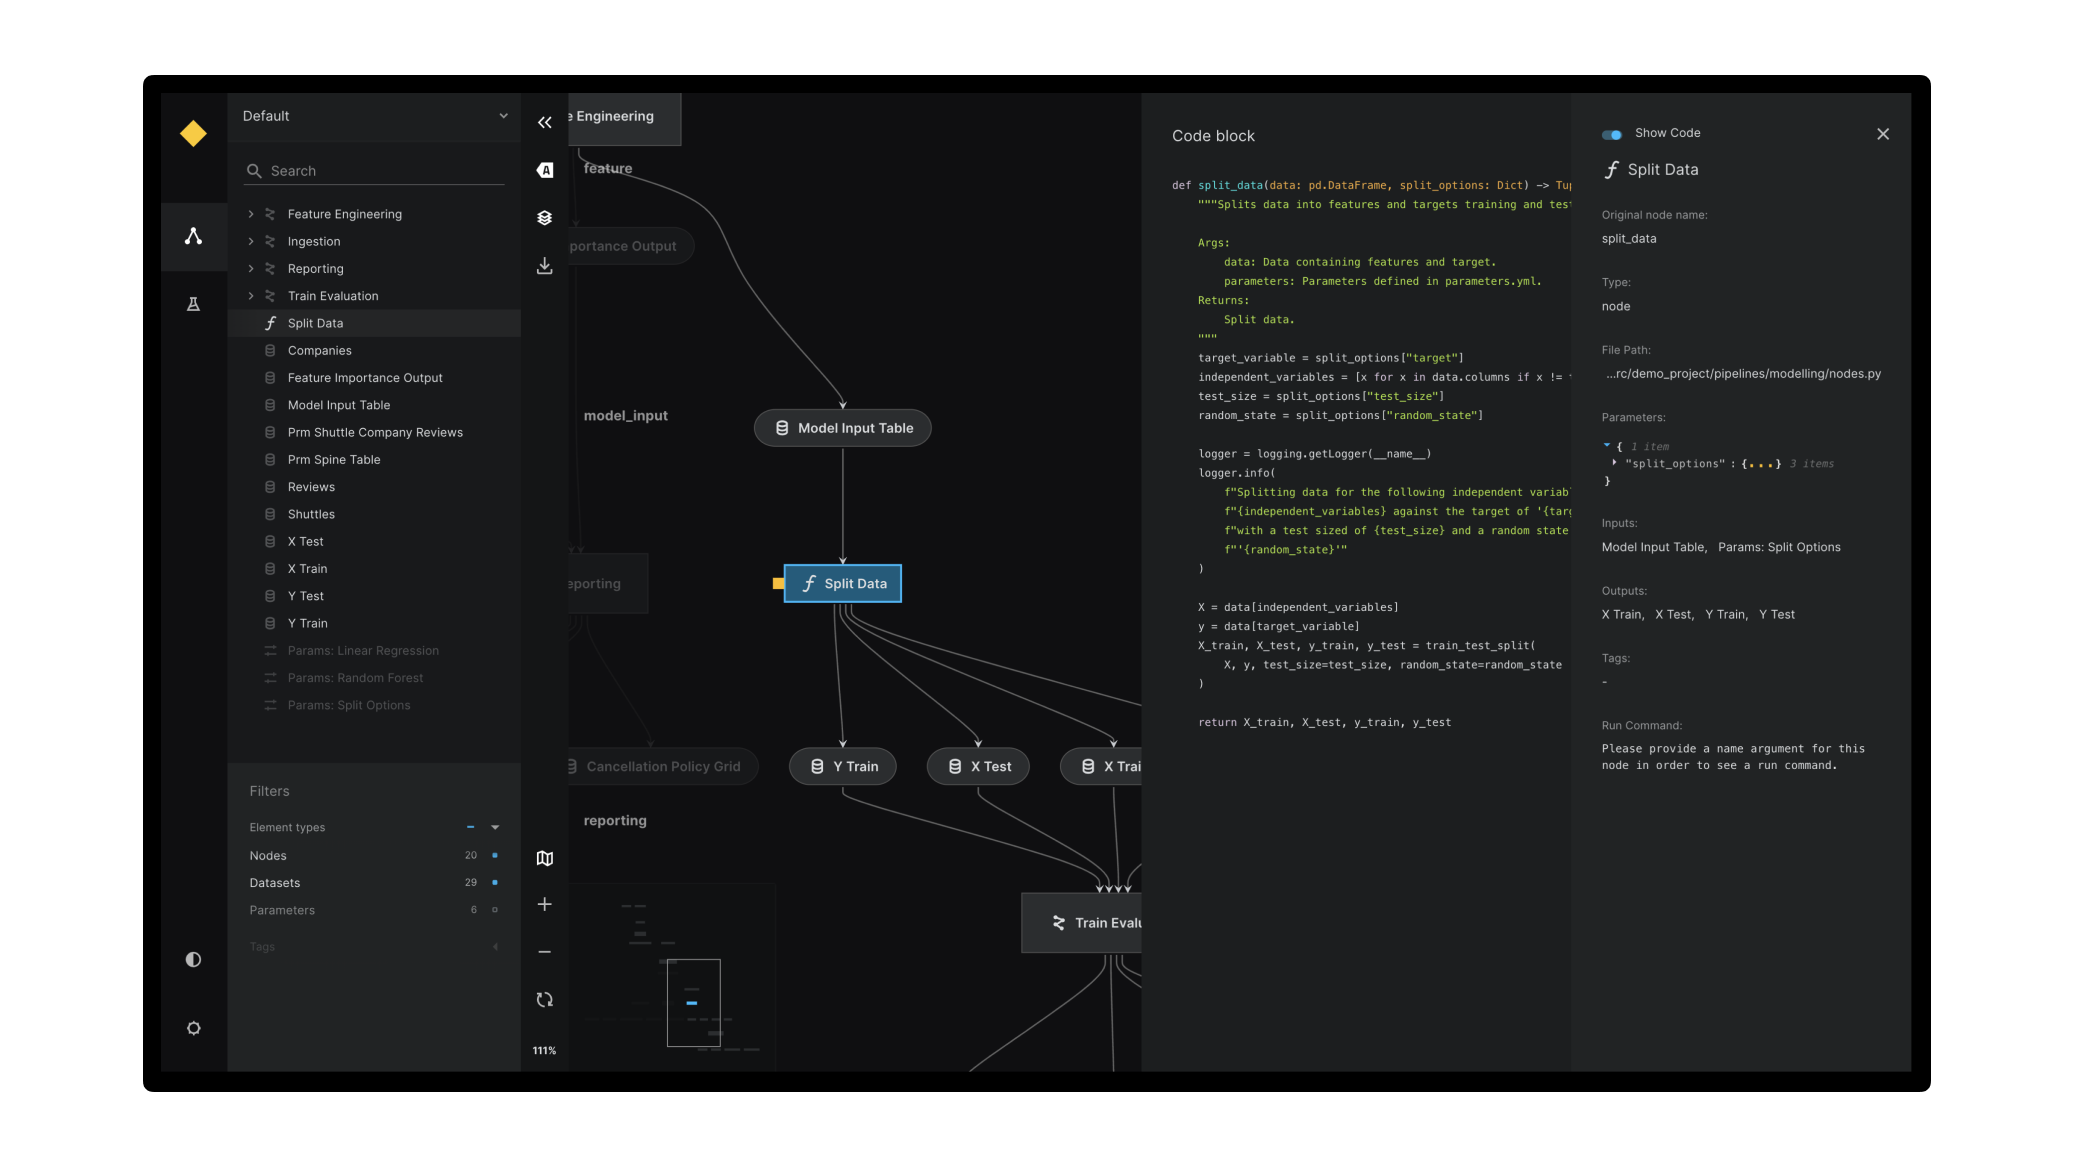
Kedro-Viz is an interactive development tool for building data science pipelines with Kedro. Kedro-Viz also allows users to view and compare different runs in the Kedro project.
- ✨ Complete visualisation of a Kedro project and its pipelines
- 🎨 Supports light & dark themes out of the box
- 🚀 Scales to big pipelines with hundreds of nodes
- 🔎 Highly interactive, filterable and searchable
- 🔬 Focus mode for modular pipeline visualisation
- 📊 Rich metadata side panel to display parameters, plots, and more.
- 📊 Supports all types of Plotly charts
- ♻️ Autoreload on code change
- 🧪 Supports tracking and comparing runs in a Kedro project
- 🎩 Many more to come
-
As a standalone React component (for embedding Kedro-Viz in your web application).
To install the standalone React component:
npm install @quantumblack/kedro-viz
To use Kedro-Viz as a standalone React component, you can follow the example below. Please note that Kedro-Viz does not support server-side rendering (SSR). If you are using Next.js or another SSR framework, you should be aware of this limitation.
import KedroViz from '@quantumblack/kedro-viz';
import '@quantumblack/kedro-viz/lib/styles/styles.min.css';

const MyApp = () => (
  <div style={{height: `100vh`}}>
    <KedroViz
      data={json}
      options={/* Options to configure Kedro Viz */}
    />
  </div>
);
To use with NextJS:
import '@quantumblack/kedro-viz/lib/styles/styles.min.css';
import dynamic from 'next/dynamic';

const NoSSRKedro = dynamic(() => import('@quantumblack/kedro-viz'), {
  ssr: false,
});

const MyApp = () => <NoSSRKedro data={json} />;
The JSON can be obtained by running:
kedro viz run --save-file=<path-to-save-kedro-viz-data-to-a-directory>On successful execution of the command above, it will generate a folder at the specified directory, containing the following structure:
<filename>/api/
├── main
├── nodes
│   ├── 23c94afb
│   ├── 28754fab
│   ├── 2ab3579f
│   ├── 329e963c
│   ├── 369acf98
│   └── ...
└── pipelines
    ├── __default__
    ├── data_processing
    ├── data_science
    └── ...
Use the main file as the input JSON for the data prop in your Kedro-Viz component.
We also recommend wrapping the Kedro-Viz component with a parent HTML/JSX element that has a specified height (as seen in the above example) in order for Kedro-Viz to be styled properly.
Our documentation contains additional examples on how to visualise with Kedro-Viz.
The example below demonstrates how to configure your kedro-viz using different options.
<KedroViz
    data={json}
    options={{
      display: {
        expandPipelinesBtn: true,
        exportBtn: true,
        globalNavigation: true,
        labelBtn: true,
        layerBtn: true,
        metadataPanel: true,
        miniMap: true,
        sidebar: true,
        zoomToolbar: true,
      },
      expandAllPipelines: false,
      nodeType: {
        disabled: {parameters: true}
      },
      tag: {
        enabled: {companies: true}
      },
      theme: "dark"
    }}
/>
| Name | Type | Default | Description |
|---|---|---|---|
data |
{ edges: array (required), layers: array, nodes: array (required), tags: array } |
- | Pipeline data to be displayed on the chart |
onActionCallback |
function | - | Callback function to be invoked when the specified action is dispatched. e.g. const action = { type: NODE_CLICK, payload: node }; onActionCallback(action); |
| options.display | |||
expandPipelinesBtn |
boolean | true | Show/Hide expand pipelines button |
exportBtn |
boolean | true | Show/Hide export button |
globalNavigation |
boolean | true | Show/Hide global navigation |
labelBtn |
boolean | true | Show/Hide label button |
layerBtn |
boolean | true | Show/Hide layer button |
metadataPanel |
boolean | true | Show/Hide Metadata Panel |
miniMap |
boolean | true | Show/Hide Mini map and mini map button |
sidebar |
boolean | true | Show/Hide Sidebar and action toolbar |
zoomToolbar |
boolean | true | Show/Hide zoom-in, zoom-out and zoom reset buttons together |
| options.expandAllPipelines | boolean | false | Expand/Collapse Modular pipelines on first load |
| options.nodeType | {disabled: {parameters: boolean,task: boolean,data: boolean}} |
{disabled: {parameters: true,task: false,data: false}} |
Configuration for node type options |
| options.tag | {enabled: {<tagName>: boolean}} |
- | Configuration for tag options |
| options.theme | string | dark | select Kedro-Viz theme : dark/light |
onActionCallbackcallback is only called when the user clicks on a node in the flowchart, and we are passing the node object as the payload in the callback argument. In future releases, we will add more actions to be dispatched in this callback.- When
display.sidebarisfalse,display.miniMapprop will be ignored.
All components are annotated to understand their positions in the Kedro-Viz UI.

We have created a kedro-viz-standalone repository to demonstrate how to use Kedro-Viz in standalone mode or embedded in a React application.
This repository provides a fully functional example of Kedro-Viz, showcasing how to integrate it into your projects. The example includes setup instructions and demonstrates various features of Kedro-Viz.
To get started, clone the repository, install the dependencies and run the example React application:
git clone https://github.com/kedro-org/kedro-viz-standalone.git
cd kedro-viz-standalone
npm install
npm start
Kedro-Viz uses feature flags to roll out some experimental features. We have the following flags -
| Flag | Description |
|---|---|
| sizewarning | From release v3.9.1. Show a warning before rendering very large graphs (default true) |
| expandAllPipelines | From release v4.3.2. Expand all modular pipelines on first load (default false) |
To enable or disable a flag, click on the settings icon in the toolbar and toggle the flag on/off.
Kedro-Viz also logs a message in your browser's developer console to show the available flags and their values as currently set on your machine.
Kedro-Viz is maintained by the Kedro team and a number of contributors from across the world.
If you want to contribute to Kedro-Viz, please check out our contributing guide.
Kedro-Viz is licensed under the Apache 2.0 License.
If you're an academic, Kedro-Viz can also help you, for example, as a tool to visualise how your publication's pipeline is structured. Find our citation reference on Zenodo.