Prometheus 和 Grafana 集成
Wiki 下的中文文档将不在维护,请访问我们最新的中文文档网站,获取最新的文档更新。
Kube-OVN 可以将网络控制平面信息以及网络数据平面质量信息指标以 Prometheus 所支持的格式对外暴露。
我们使用 kube-prometheus 所提供的 CRD 来定义相应的 Prometheus 监控规则。用户需要预先安装 kube-prometheus 来启用相关的 CRD。
- 安装 kube-ovn-pinger 相关监控
kubectl apply -f https://github.com/raw/kubeovn/kube-ovn/master/dist/monitoring/pinger-monitor.yaml
- 安装 kube-ovn-controller 相关监控
kubectl apply -f https://github.com/raw/kubeovn/kube-ovn/master/dist/monitoring/controller-monitor.yaml
- 安装 kube-ovn-cniserver 相关监控
kubectl apply -f https://github.com/raw/kubeovn/kube-ovn/master/dist/monitoring/cni-monitor.yaml
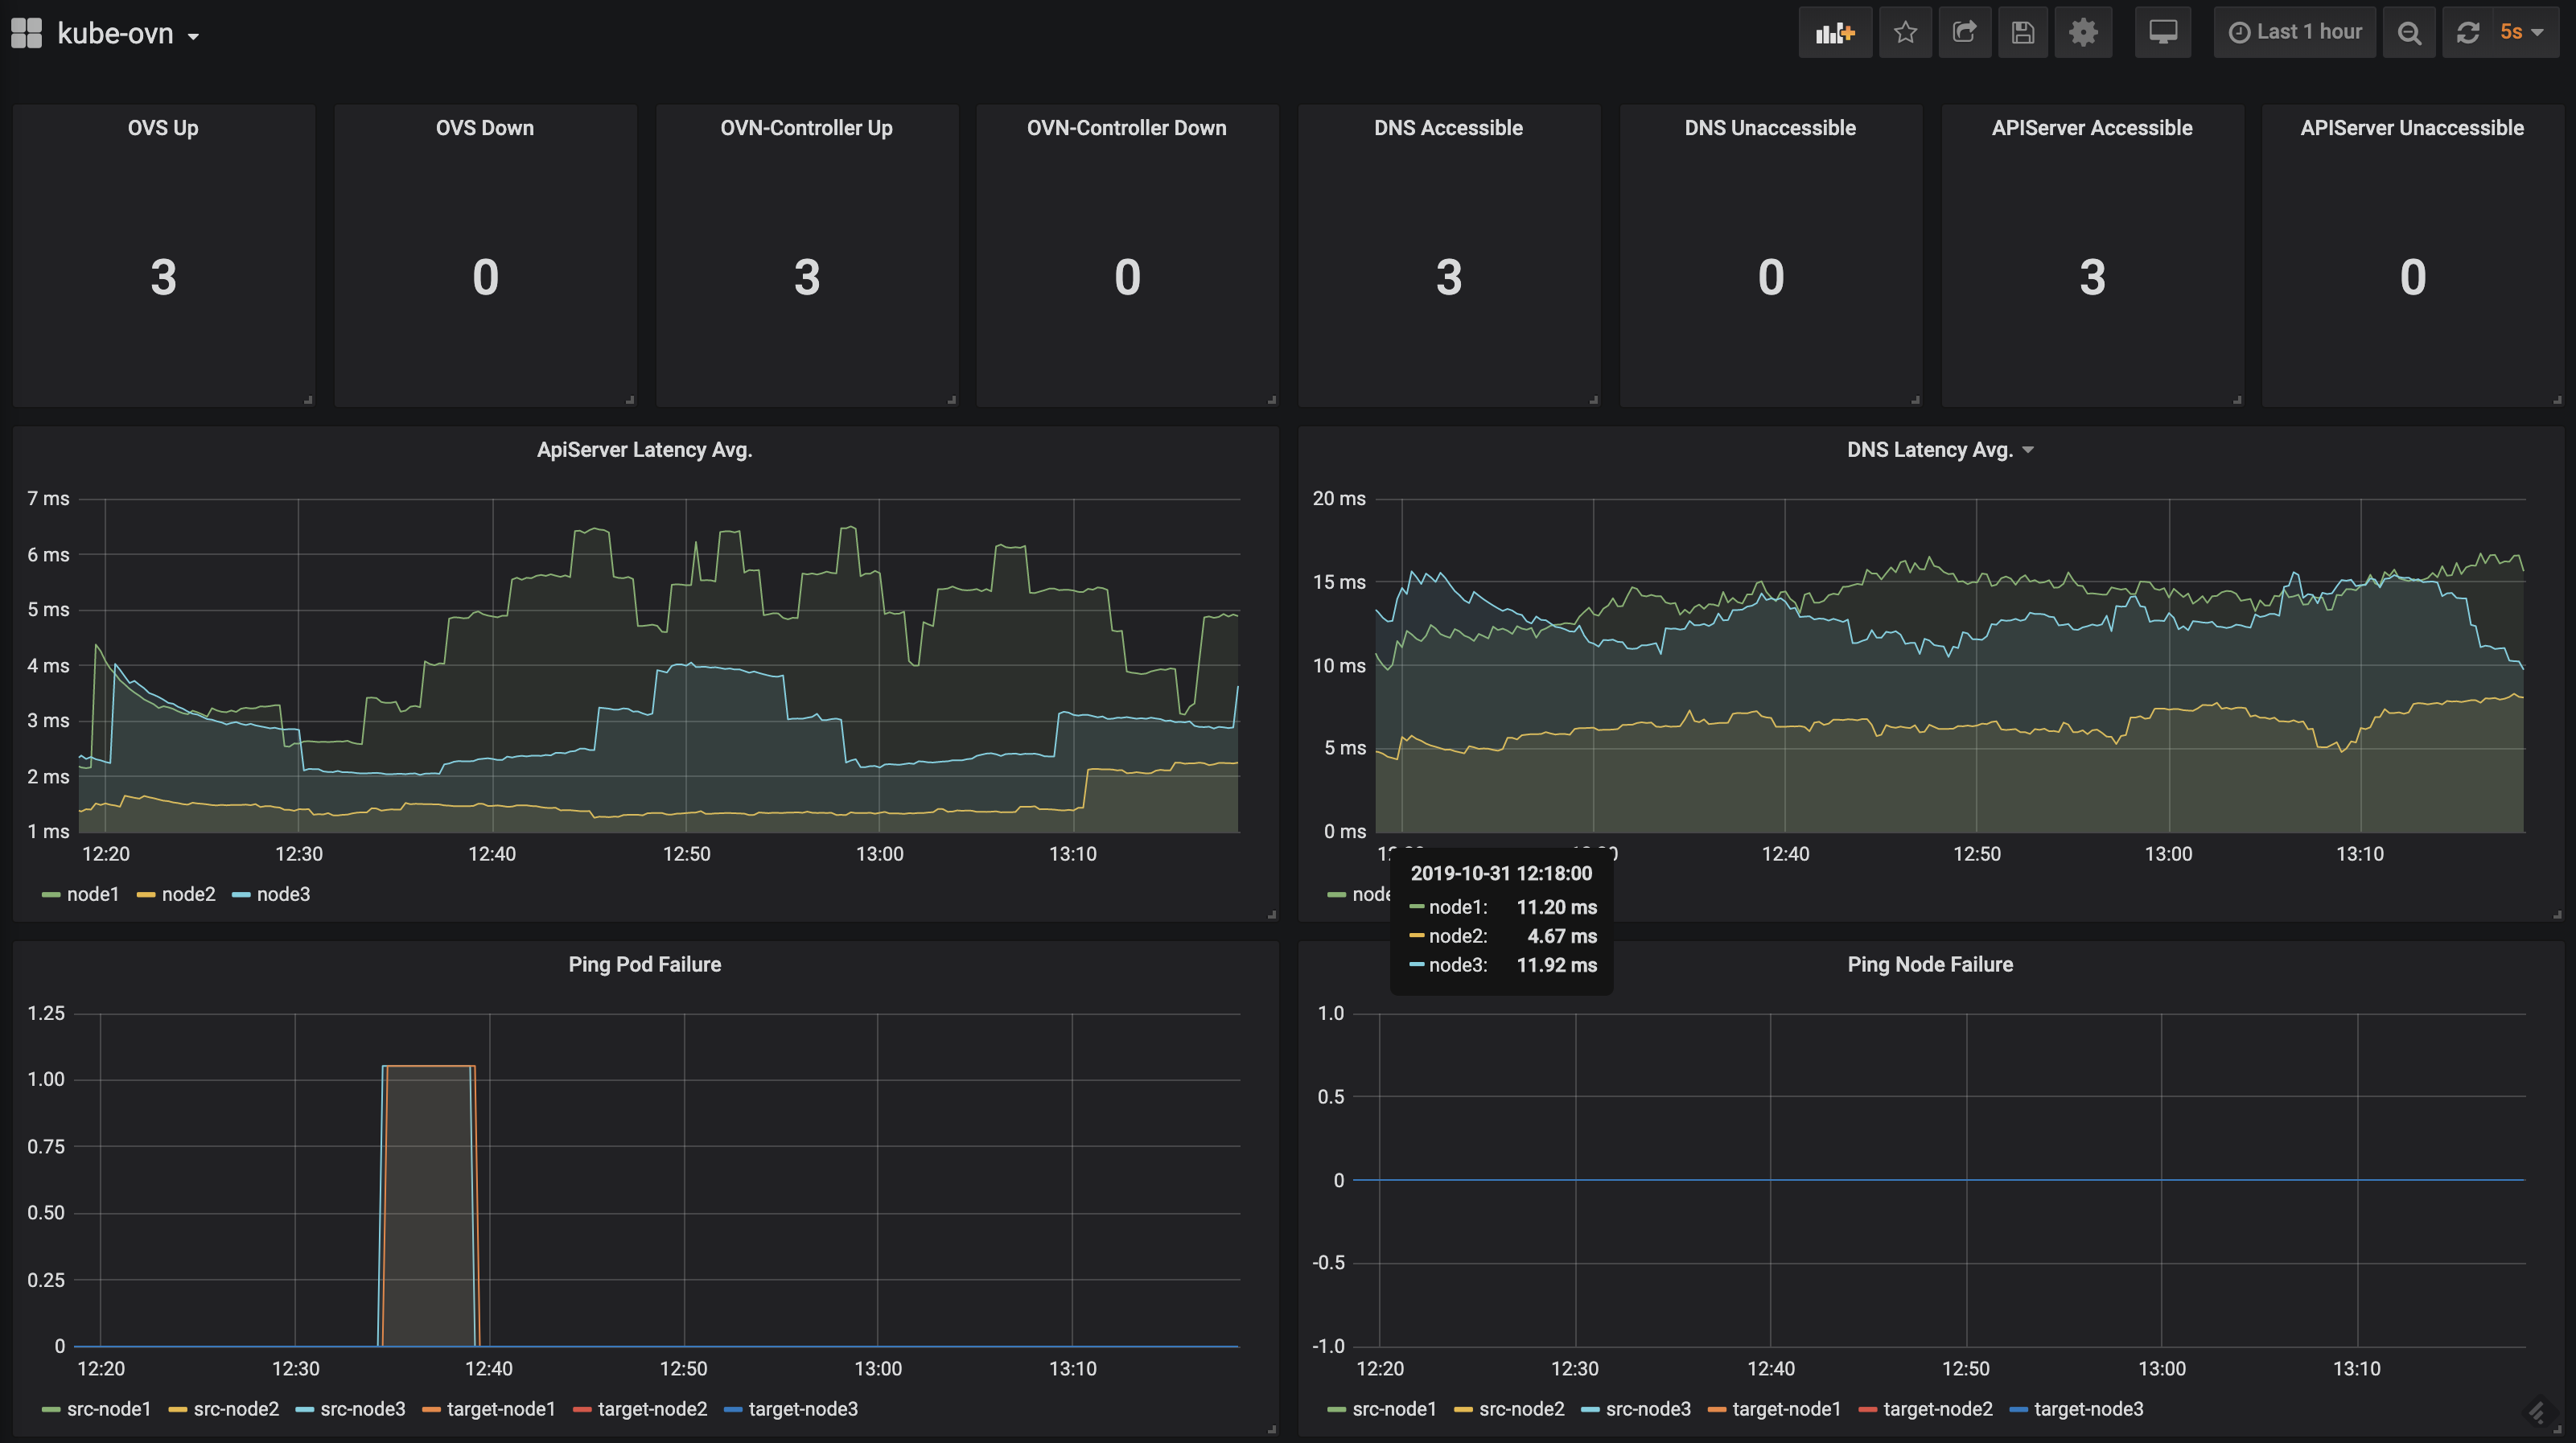
Kube-OVN 还提供了预先定义好的 Grafana Dashboard 展示控制平面和数据平面相关信息。
- 下载对应 Dashboard 模板
wget https://github.com/raw/kubeovn/kube-ovn/master/dist/monitoring/controller-grafana.json
wget https://github.com/raw/kubeovn/kube-ovn/master/dist/monitoring/pinger-grafana.json- 在 Grafana 中导入模板
导入成功后可在 Grafana 中看到如下 Dashboard