My name is Romain Guion, and I am heading an engineering and data science department at a London-based startup called Vortexa. I previously worked as a data scientist with an entertainment Los Angeles-based startup called Pluto TV and with an AI-driven transportation startup called Padam. Prior to that I worked for 4 years in the healthcare industry as a consultant, project leader and scientist. I also briefly worked as a M&A analyst in the energy industry and as a rocket scientist.
I am also a graduate from the University of Cambridge, and I hold a MSc in Math and Physics from Ecole Centrale Paris. The maths covered advanced statistical learning, discete-time stochastic processes, optimization, signal processing, financial mathematics, as well as a range of linear algebra, analysis and topology topics.
Although Data Science is mainly about critical thinking, people like to talk about tools, so here it is:
- What I use most commonly: Python (NumPy, Pandas, Matplotlib / Seaborn / Plotly, SciKit Learn etc.), Matlab, Excel, and SQL.
- I am also comfortable working with Scala, R, other Python libraries (PySpark, Keras, TensorFlow, SciPy, Spacy, NLTK), and other programming languages and software such as Tableau.
All my professional work is confidential. My LinkedIn captures my professional journey. Until now, I never took the time to capture my side projects, so work in progress, and suggestions welcomed!
(Note: one bit of my work that is public are my patents)

-
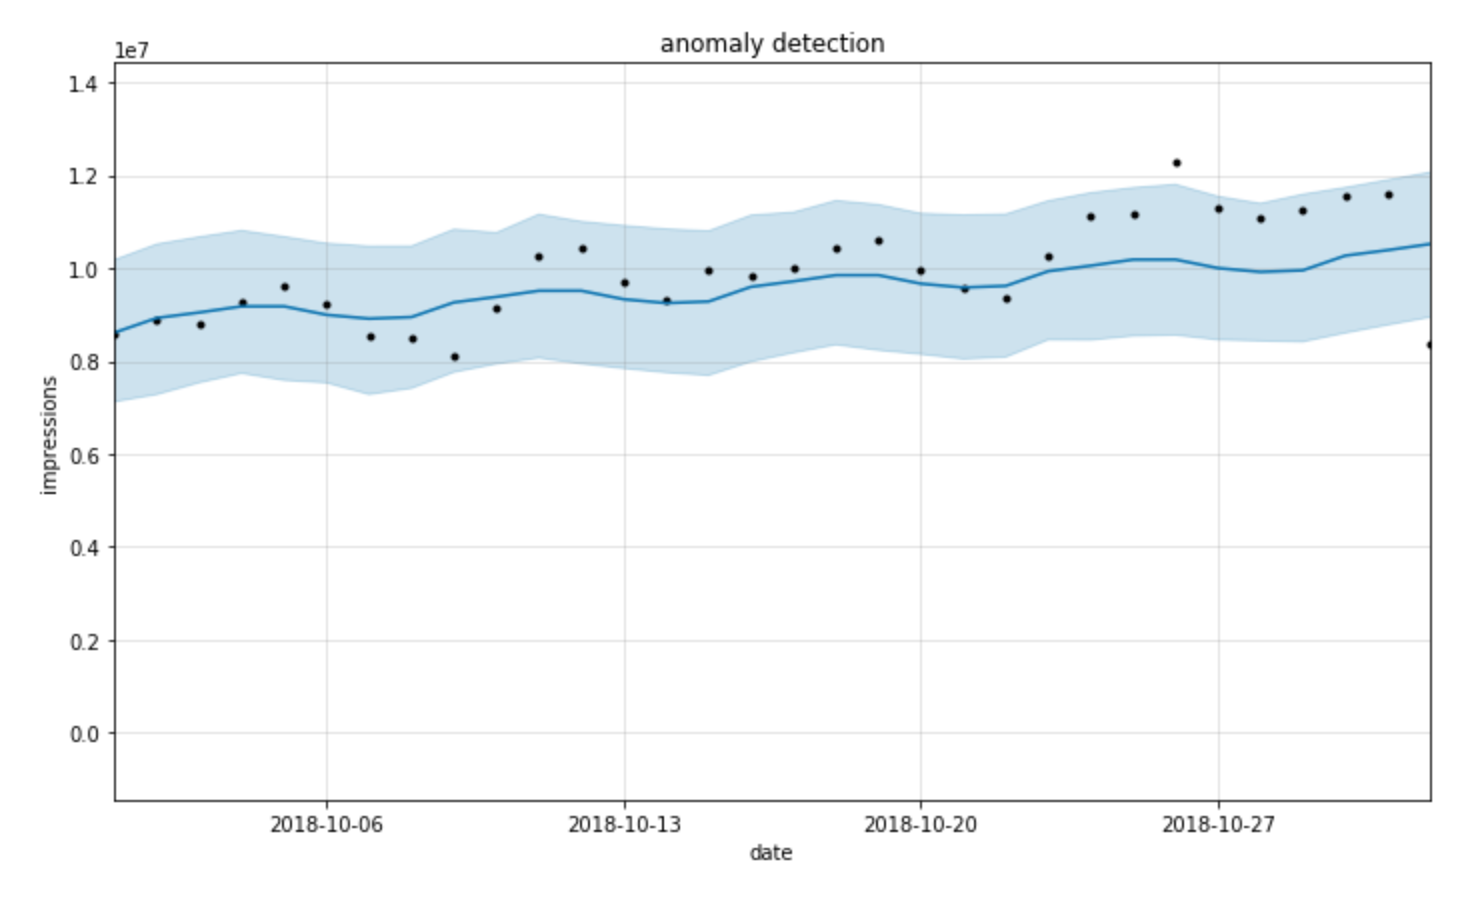
Freelance Data Scientist for Padam.io. Padam brings AI-powered on-demand bus services to medium and low density areas. My intervention is focused on the UK market. My mission started very broad: how can we improve our clients' profit, and Padam's service in general. I started framing generic revenue and cost questions, and went down to product management questions. I then got access to 3 years of an anonymised database, and mapped growth bottlenecks and potential levers. I then went on to define KPIs for customer retention and operational efficiency, and I am working on optimised processes to increase those. In practice this entailed building a machine learning pipeline to predict the number of bookings as a proxy to customer satisfaction, and interpreting the main contributors as KPIs to improve. I also looked at geographical and temporal mismatch of supply & demand to redefine bus lines. The details are obviously confidential. Tools: iPython, pSQL. 2018
-
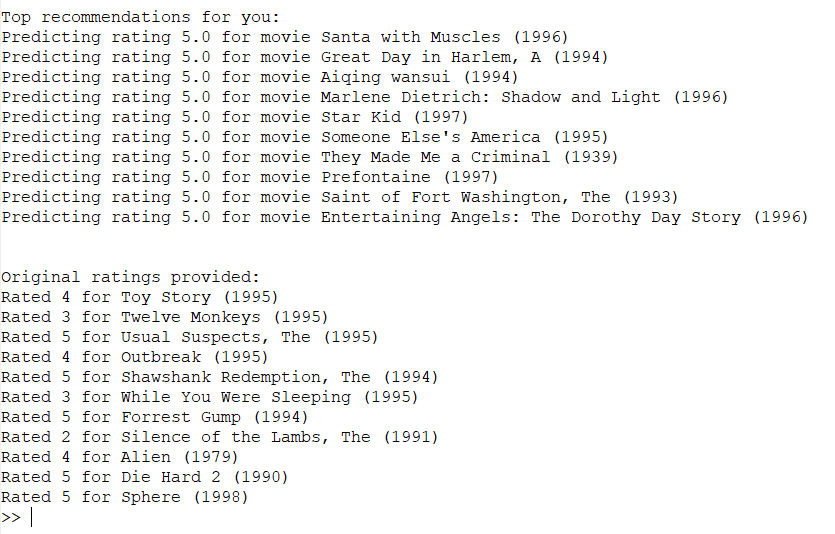
Current project: multi-user movie recommendation system. I am working in collaboration with a Java developer on doing an app that makes movie nights between friends smoother. I am covering the machine learning aspect - multi-user / multi-preference recommendation system. If the algorithm works well, there may be many applications. Our current approach is a cloud database and machine learning web services provided to an Android app. The recommendation engine is a variation of mono-user collaborative filtering and low rank matrix factorisation. Tools: Python. 2018
-
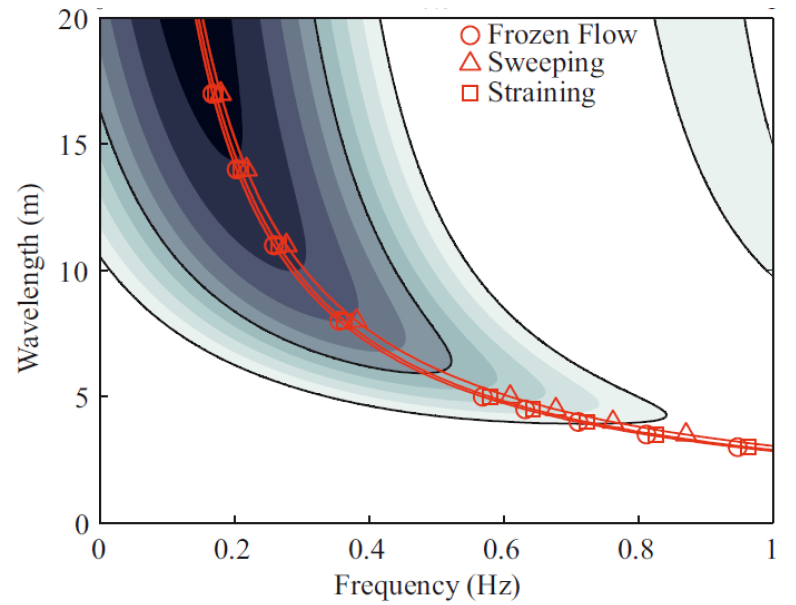
Space-time analysis of eddies captured by ADCP devices. Work done at the Whittle Laboratory at Cambridge around 2013. The aim was to help tidal turbines work better, as many were working well in the lab but broke on-site. I looked at the most popular device used in marine environment to measure currents and eddies: the Acoustic Doppler Current Profiler (ADCP). I found that there is a significant gap in the frequency and size of eddies this tool could capture. And this blind spot is right in the range that can break tidal turbines and is site-dependant. This led to a conference presentation at Oceans14 in St John's, Canada, and a few papers. Tools: pen & paper, and Matlab. 2013
-
Transportation network design optimization using custom genetic algorithms - application to Hong Kong railway. Work done at Ecole Centrale Paris in 2011. In this project we were looking at transportation networks, and given certain nodes and passenger journeys, how best to chose lines running through them. One part of the team looked at applying standard algorithms, while I developed my own evolutionary algorithms and implemented them in C++. I defined lines as entities that could mate, and the mating process would have evolutionary-inspired processes such as mutations, crossing over etc. To set the evolutionary pressure I came up with a purpose made Lagrangian multiplier, which really had a massive impact on the optimization performance. With the same team we made a broad review of artificial intelligence techniques at the time. We also quickly looked at teaching a bot to move on a 2D grid and get food using a very basic reinforcement learning technique, but the algorithm was barely better than random! (oups!). Tools: pen & paper, and C++. 2011
-
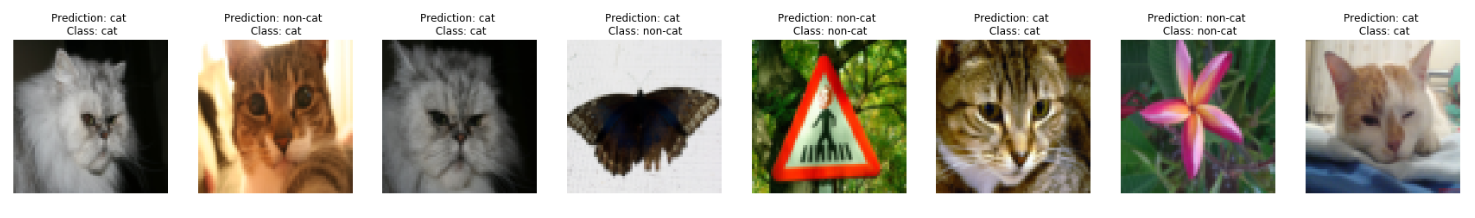
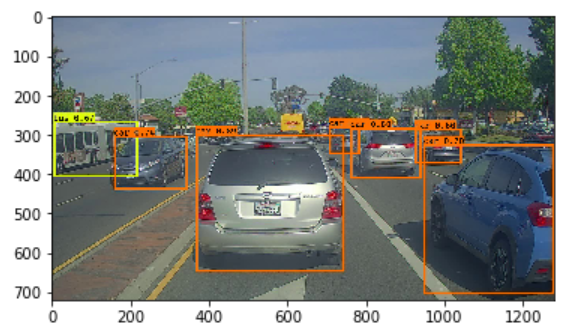
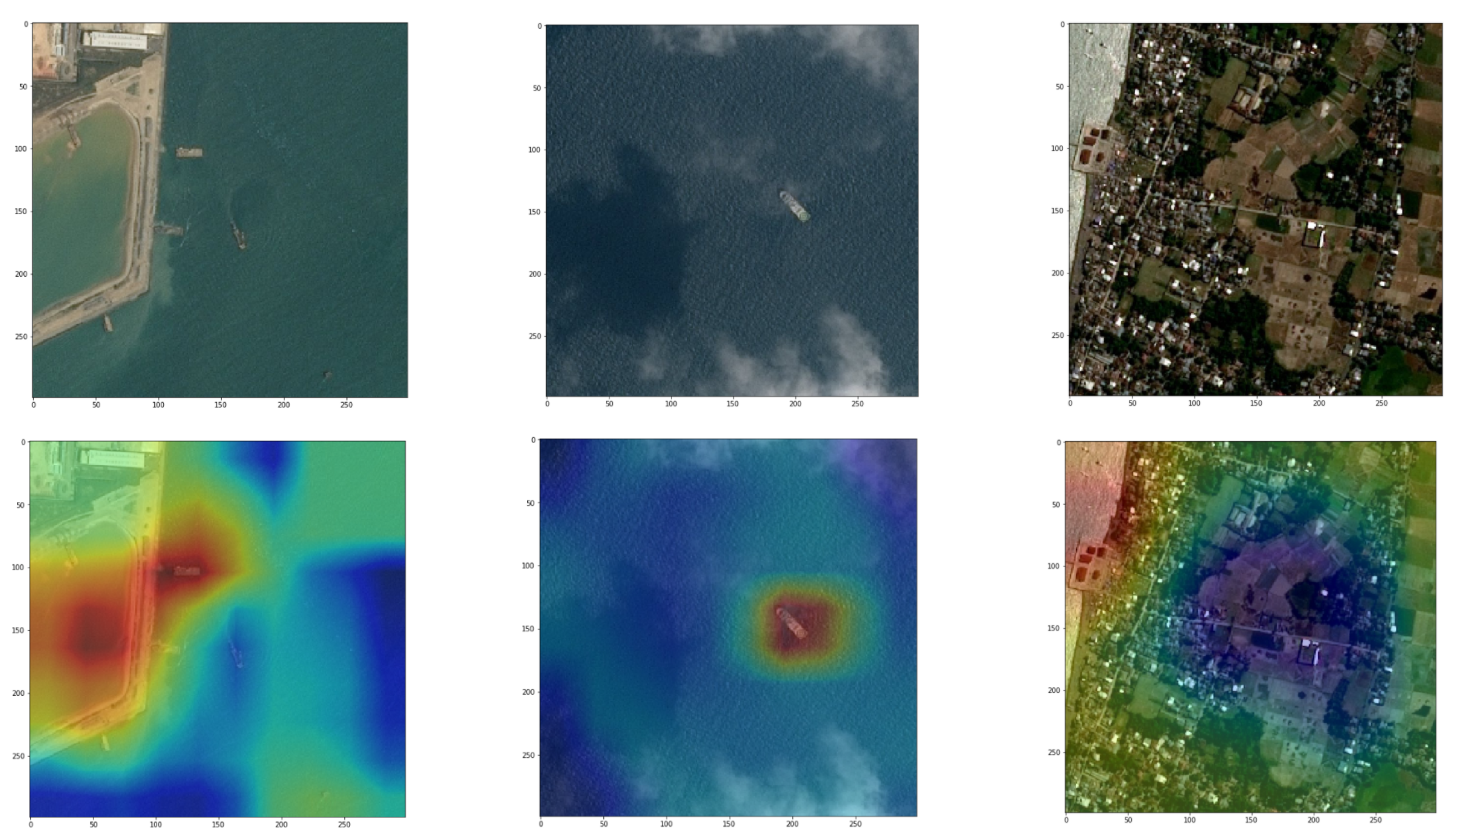
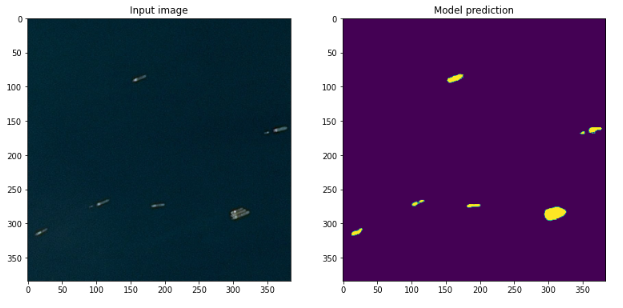
Ship detection from satellite images:
- first blog post showing how a simple LeCun-style ConvNet achieves 95% accuracy in a few lines of code,
- second blog post exploring transfer learning and decision interpretability through GAP/GMP's implicit localisation properties.
- third blog post localising ships and classifying each pixel of the image as being part of a ship or not. This is using a U-Net structure for image segmentation. 2020
-
Forecasting bike rides at the network level and at the station pair level. This was a data challenge I had to complete in a very limited time period. My first approach is focused on time-based trends, leverages Facebook's Prophet package. In a subsequent algorithms, I explore network effects and clusters of bike stations whose demands are correlated. Overall, the biggest learning for me was to structure the problem and potential solutions in details, and realize many solutions boil down to the variance vs bias problem. Indeed, to reduce noise (variance), aggregating data across space and time is effective, but only as long as the aggregated events are reasonably i.i.d. When one departs too far from this it creates bias. Tools: Python. 2018
-
Freelance Data Scientist for Cetrix Cloud Services. The client wanted to leverage Hubspot and Salesforce to automatically identify fit and interest points. My role was to scope and plan how to harvest user intent for dynamic adaptive marketing (e.g. personalized webpages or emails), given current and future data. Tools: Python. 2018
-
Leads prioritization for a start-up in Los Angeles. The company was looking at increasing the conversion rate of its call center given limited resources. I was sent a list of 10,000 anonymized leads that had been called 1-3+ times, and the document captured the time to reach out, call duration, what the main objection of the customer was, and whether it had converted or not. The key for me was to shift from customer conversion prediction to call conversion predictions, and think of calls as if they were evolving in a sort of Markov-chain. The states of this Markov chain would be the objections, but the reason why it isn't a true Markov chain is (i) that more than one step of history was required, and (ii) that the initial state seemed to matter quite a bit - I thought of this as a customer Persona. The result was a prioritization algorithm in python based on (i) a Random Forrest Classifier that would predict conversion probability, and (ii) a time-sensitivity algorithm that would manage the different impact of calling back later of each lead type at each stage of the sales process. Tools: Python. 2018
-
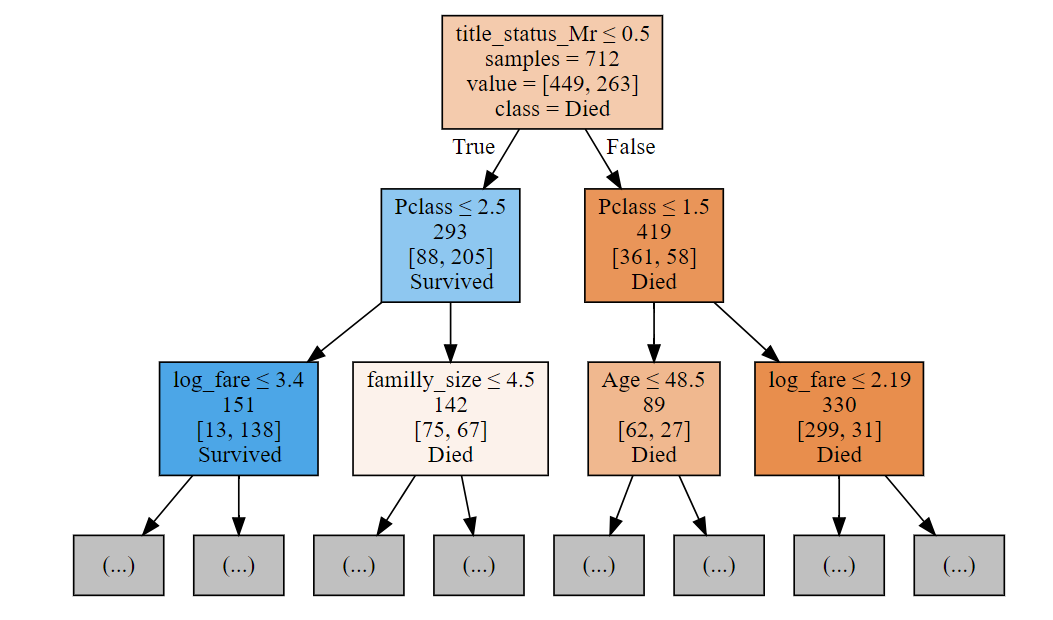
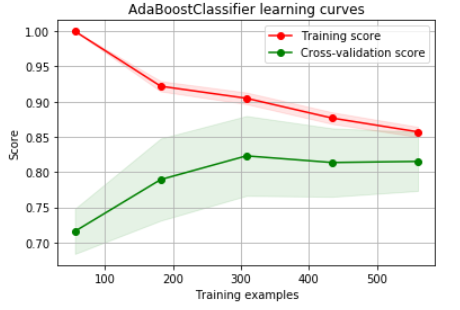
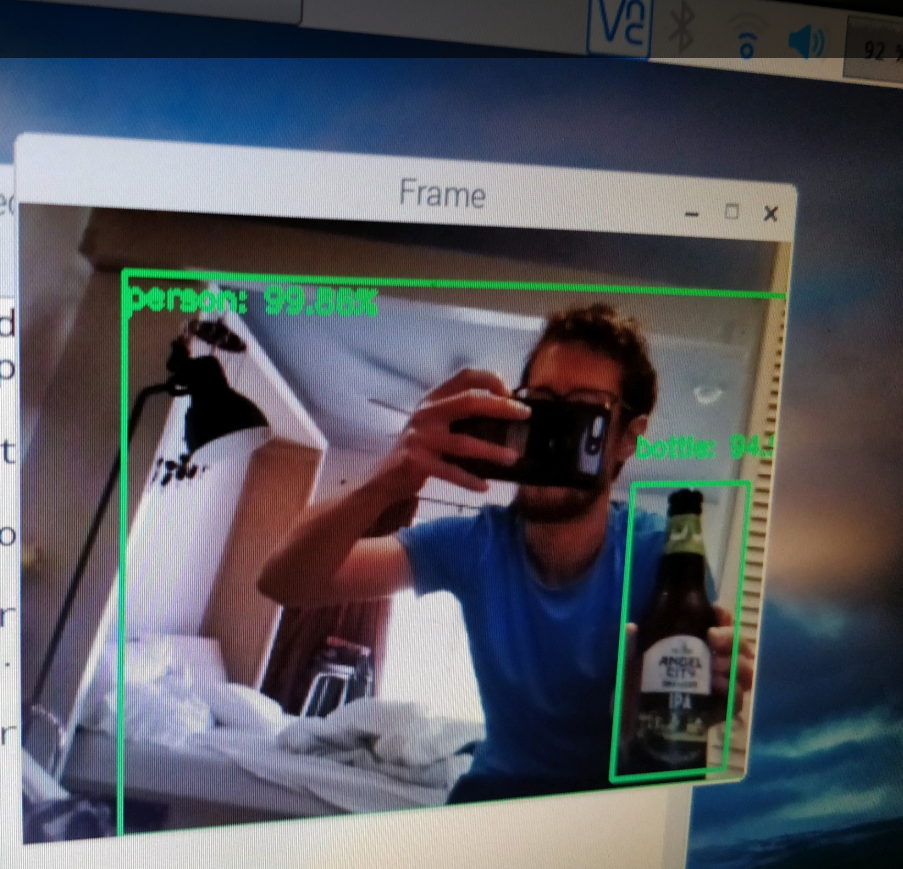
Workshop at HIT: Kaggle Titanic dataset and Raspberry Pi with capacity-touch sensor and camera for object recognition. Check-out my Python Titanic kaggle kernel (machine learning and data science). I prepared this quickly for a workshop I co-led at the Harare Institute of Technology (Zimbabwe) in 2017. We had 13 second and fourth year cybersecurity students and a couple of professors attending our workshop. We designed the workshop to broaden their horizon, and help them independantly explore a few topics. Entrepreneuship is vital in Zim. We chose to introduce the students to Data Science with the titanic dataset, as they then become part of the Kaggle community and can keep on learning by themselves. We thought hardware was also important, so my friend brought a few Raspberry Pis with two modules: capacity-touch sensor and the camera. The capacity-touch sensor was relevant for the students to detect when people touch a door handle or another conductive surface. For the workshop we ended up doing something more interactive and build a piano using spoons, apples and bananas. The camera was for intrusion detection, using openCV and tensorflow for image recognition. The rational is that motion sensors create a lot of false positive alerts, as they can be triggered by a moving branch, a dog, or someone authorized to be in the house. We thought this could become a business, but realised Google had been working with Nest for a year to do just that. Competing with Google on AI is hard. Tools: Python. 2017
-
Website. My first contact with programming was when I was 13. I did an ugly website in html and css, and an ok forum in PHP using MySQL. I thought it'd be funny to capture this project here! 2002
Math
-
A/B testing statistics - intuition and derivation for power analysis. Online resources on A/B testing tend to be black boxes with very top level insights. My experience is that it prevents experimenters from truly understanding what’s going on. In this document, I give a brief introduction of what A/B testing is used for, and focus on providing a simple, yet more detailed intuition of the frequentist statistical logic. 2018
-
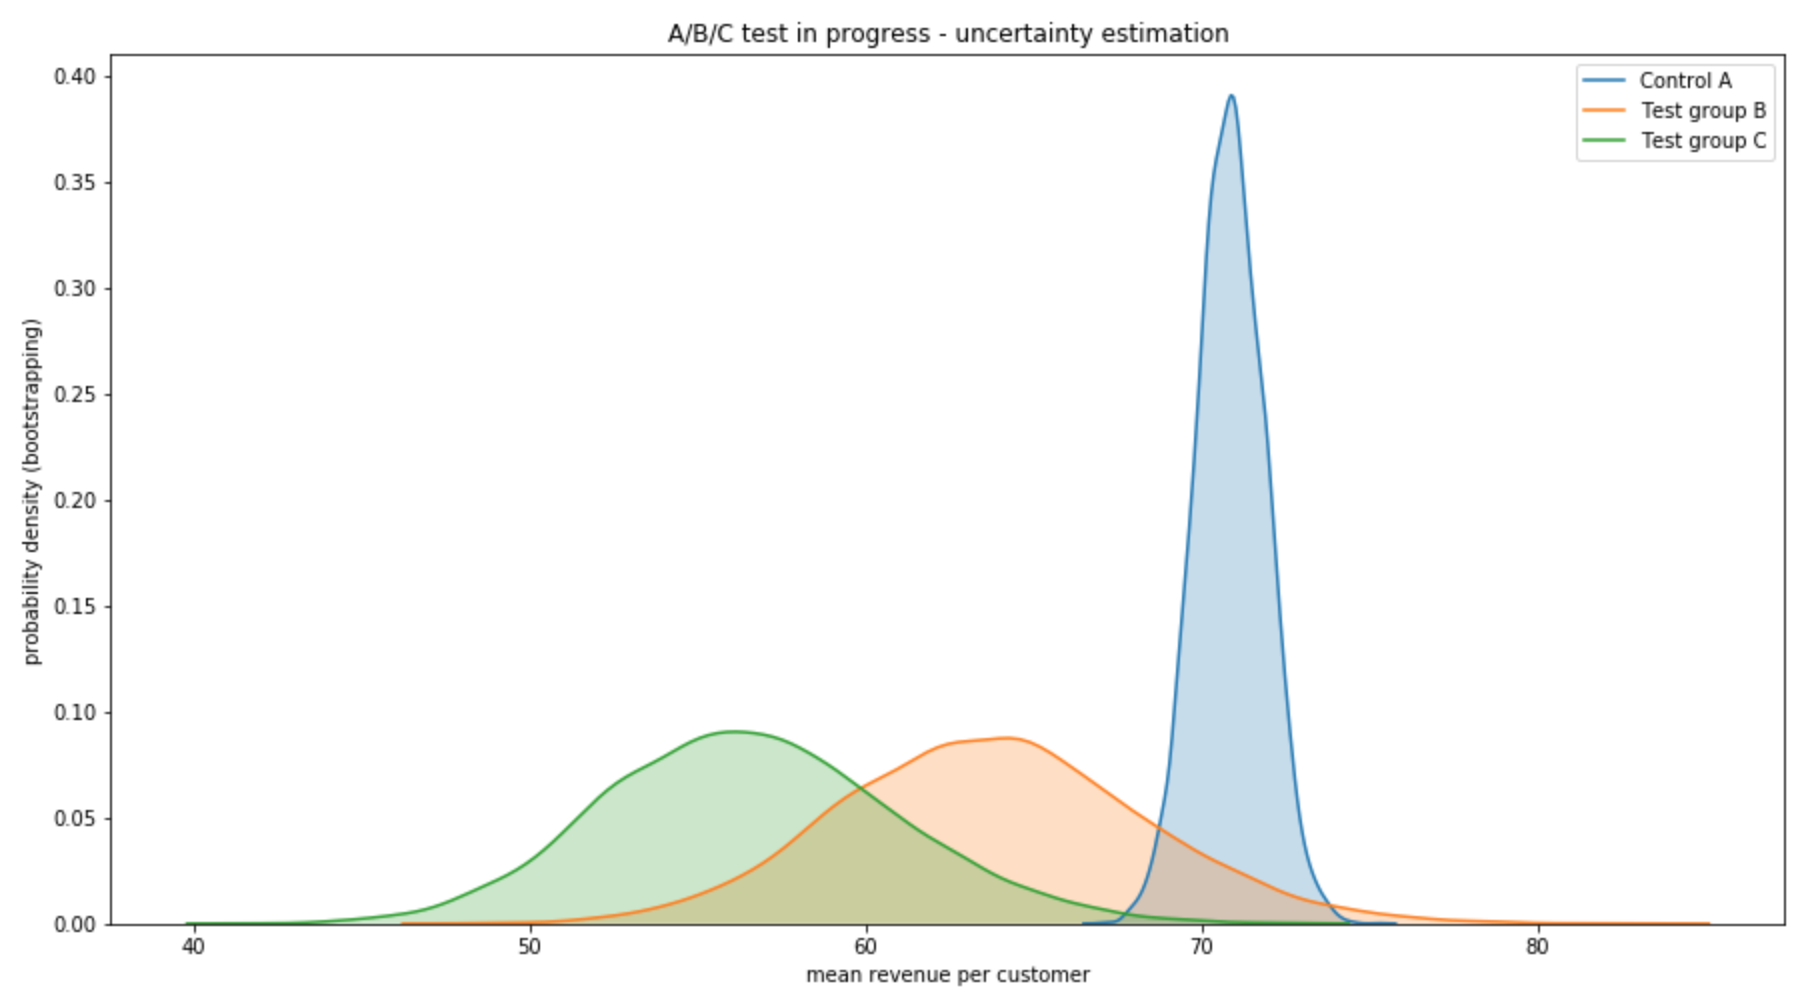
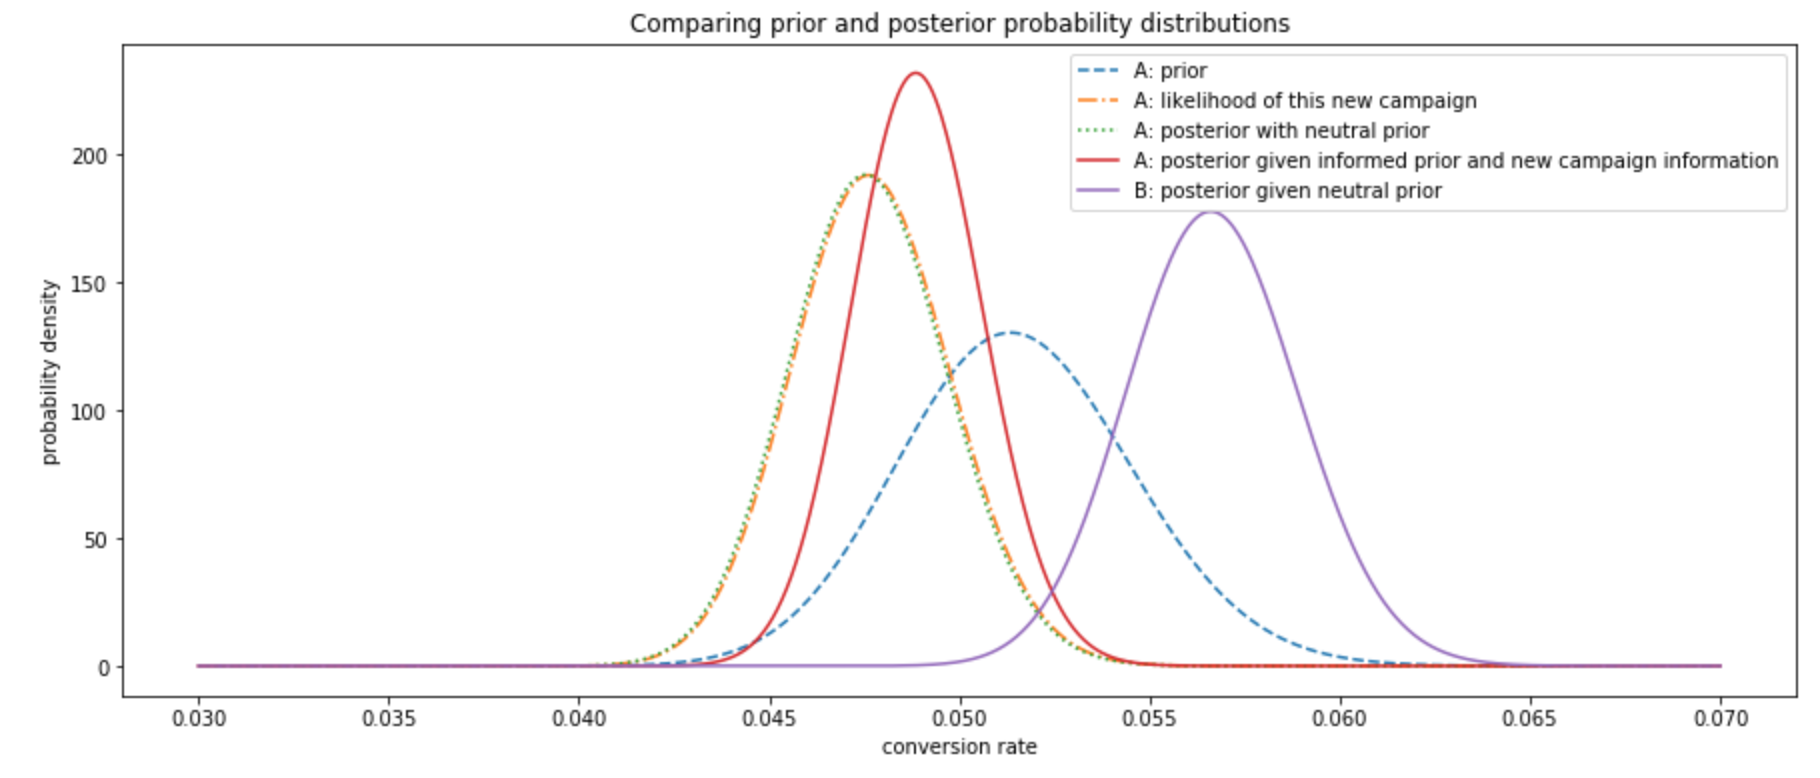
A/B testing - bootstrap and bayesian perspective. This post explores how to represent and interpret data while it is being collected. In this post we take a concrete marketing A/B test with various conversion rates and revenue per customer in each case. After quickly going over bootstrap methods to estimate uncertainty, we consider Bayesian probabilities as a way to model previous knowledge. In particular we enter some details about conjugate priors. 2018
Python
-
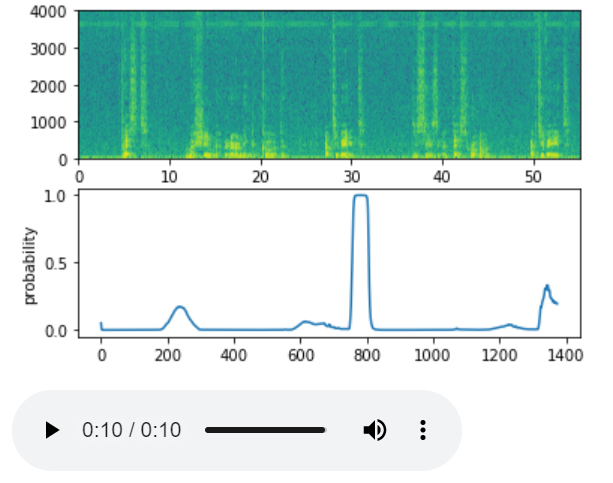
Recognition of word "activate" from audio clips, using a Convolutional layer and GRU (deep learning NLP. Spectrogram above. Listen to an example with a chime after the word detection! 2020
-
LSTM neural network generating jazz impro, based on the 5th course of the Deep Learning Coursera specialisation. Listen to an example!. 2020
-
Vulgarisation medium blog post on how a couple of hours of machine learning can turn a repetitive business task into an automated self-improving process. 2019
-
Very simple chatbot engine implementing (a simplified version of) the architecture of a paper on a Facebook dataset of Stories, Questions and Answers. The paper presents a structure to (a) represent the Stories as bag of words and taking into account word sequence within the sentence, and sequence between sentences, and (b) combine the stories and questions into some sort of prediction through some sort of LSTM RNN. 2019
-
Predict amazon reviews rating / sentiment using TfIdf, and Vador (NLTK) as features, combined in a simple classifier. I also played with Word2Vec (Spacy), and found that representing the reviews as the sum of its word vectors was a bad idea (in the simple implementation I used). Indeed, using the resulting vector as a feature to my classifier seemed to generate no predictive power to my classifier. The issue probably comes from the sum / average operator that effectively increases entropy. A LSTM would probably be the classic tool, but I still like to test the simple tools first (although with little hope in this case). Perhaps another type of non-linear word-vector combination, perhaps weighted by TF-IDF would be a sensible step? 2019
-
Improving matching rates on a two-sided market place. This was a 48h data challenge I had to cram into 24h. The aim was to deliver 2-3 actionable recommendations about how to improve matching in the market place. Here are the links for the presentation of my results and the python notebook. 2018
-
Causal inference - Lalonde dataset. Causal inference is what people typically call "controlling for confounding factors". Causal inference is used in observational studies in all fields, e.g. public health, econometrics and marketing. This specific example explores the famous Lalonde dataset, which was a particularly unbalanced study looking at the effect of a job training program. In this notebook I use propensity matching to separate the treatment effect from an unbalanced population. Tools: Python, CausalInference package. 2018
-
Ads dataset. This is an anonymised data set of 19k lines of data about ads creatives, networks, number of days before release, number of views and actions taken by viewers. In this file I disentangle the impact of creative artists from the broadcasting context. I start with simple averages, then use a fixed effects model, and introduce an experimental random forrest classifier coupled with a fixed effect model. Tools: Python, Statsmodel, Sklearn. 2018
-
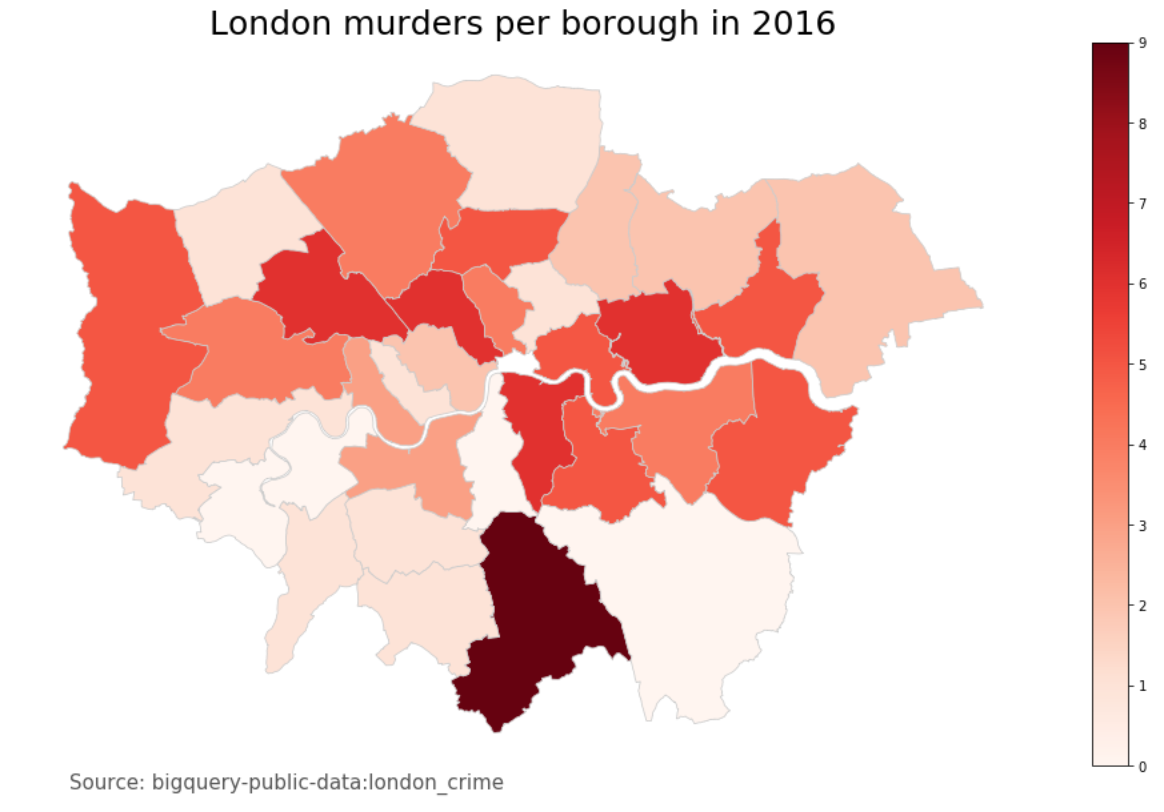
Planning a marketing campaign. A ficticious start-up is planning a street marketing campaign in London. Leveraging a public data set, I identify the best place and time to run the campaign, what are the key assumptions made, and how to test them. 2018
-
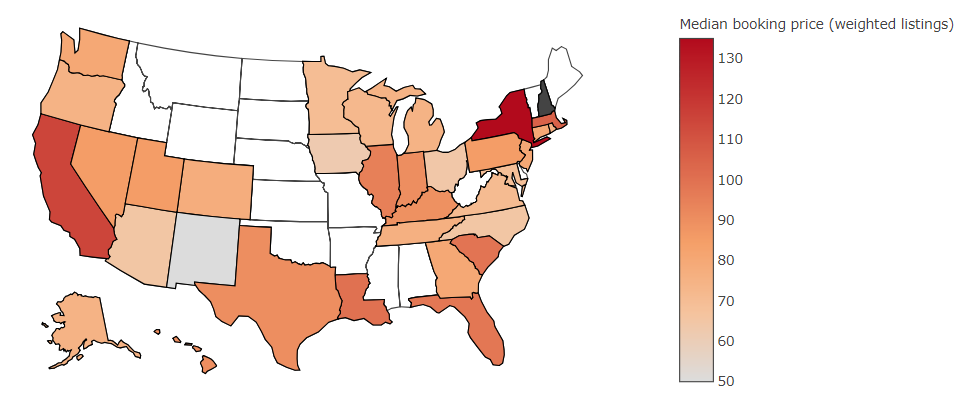
TreefortBNB - a fun Priceonomics puzzle. The puzzle gives 10,000 lines of data on a business similar to Airbnb. The aim is to get nice stats on the most expensive cities in the US on TreefortBnb.com, so that Priceonomics can write an article about it. The key insight for me was a paradigm shift from listing statistics (the raw data) to booking statistics (which is most representative of user experience). This is still a running puzzle, so I won't give more details. 2018
Most of the mini-projects that follow were pretty easy and with extensive guidance. However, they were nevertheless pretty insightful, as it helped bridge the gap between what I know in math and algorithmics and real world applications.
Java project
- Wrote a program deciphering a file which has been encrypted with the Vigenere cipher. This implementation not only detects the language of the encrypted message, but it also detects the key length, based on match rate with a language-dependent dictionary. Once the key length and language is known, Vigenere cipher breaks down into interwoven Caesar ciphers, which can often be broken with a frequency analysis of the most common letters in the language (for long enough texts compared to the key length). This cipher was considered unbreakable until 1863 (from its invention in 1553). 2020
Java notes. While following some java courses, here are some key notes:
- ArrayList is useful when the arraysize isn't fixed. Lookup is still O(1) when we know the index. Behind the scene ArrayList has an array perhaps 1.5 the time of what's currently full, and so adding elements to the arraylist usually is also O(1). From time to time though, the Array behind the scene is too small to add a new element, and a new array needs to be created, and in this case there is a O(n) cost to copy all the data. When building an ArrayList by adding the elements one by one, knowing roughly how big the Array will get will help with performance. Good to note also that ArrayList uses boxed types (like Integer) while Array can use java native types (like int), so Array is the most performant option, if appropriate.
- HashMap: when the number of elements grows too much for a fixed number of buckets, more collisions happen. In JDK 8, HashMap will implement any densely-populated bucket as a tree (if the key can be ordered), so that even if there are lots of entries with the same hash code, the complexity is O(log n). To avoid having too many collision and approach the amortised O(1) hashmaps are known for, the HashMap will optimise performance by increasing the size of the backing array / # buckets for the hashes by 2x typically (this means an expensive copy operation O(n)).
Scala. When I followed Martin Odersky's EPFL course on functional programming in Scala and Spark. Some key learnings:
- functional programming core is about non mutable variables, and is in opposition to procedural languages. Scala / functional programming isn't an alternative to object oriented programming, and mixes well with it
- functional programming makes parallelisation easier, as avoiding mutable variables by design helps with concurrency
- scala mixes 2 principal forms of polymorphism: subtyping and generics. The two main interactions areas are bounds and variance
Data Science. While following online courses, I did quite a few mini-projects. Those were very simple and top-level, but a good excuse to get up to date with the popular python tools people use in data science today: Numpy, Pandas, Matplotlib, Seaborn, Plotly, SciKit Learn, Python SQL interface, SciPy, TensorFlow, NLTK, SHAP, lifelines etc. Here is a few for which I took some notes:
- NLP: non-contextualised word representation (Word2Vec, Glove) and contextualised word representation (ELMo, BERT) -> important particularly for words with different meanings
- randomised control trials: effect of Levamisole and Fluorouracil on patients who have had surgery to remove their colon cancer. Analysis (traditional statistics or ML techniques), interpretation, evaluation of risk reduction and C-statistic on the ability to predict the risk of an outcome, and concordance-statistic for benefit of treatment 2020
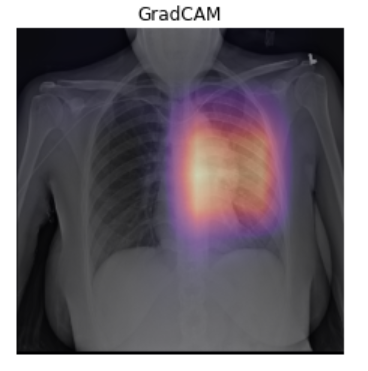
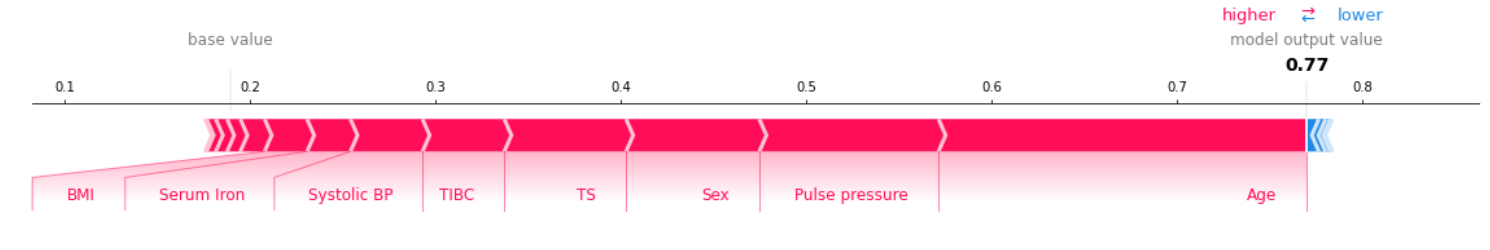
- How SHAP values enable feature importance estimation for any kind of models, making traditionally black-box ML models interpretable 2020
- Survival model, in particular how to model censored data (e.g. a patient that left a trial halfway through at say 12 months and didn't die while being monitored: there is information in the fact they didn't die after 12 months, but how to capture it in prognosis models?) 2020
- Handling null values is always a difficult problem. A handy approach I discovered and tried out on a medical dataset is iteratively modelling and predicting missing values, using sklearn's IterativeImputer.
- Yelp ratings' prediction from comments - simple natural language processing (Bag-of-words, get rid of common words, TFIDF, inverse document frequency). 2018
- SMS spam classifier - simple natural language processing, multinomial naive bayes (Irvine dataset).
- handwritten digits (MNIST dataset) - TensorFlow and multi-layer perceptrons.
- loan default prediction - Random forrest.
- tumor malignant or benign - SVM (sklearn breast cancer dataset).
- iris flower dataset - SVM (historical dataset from the 1930s).
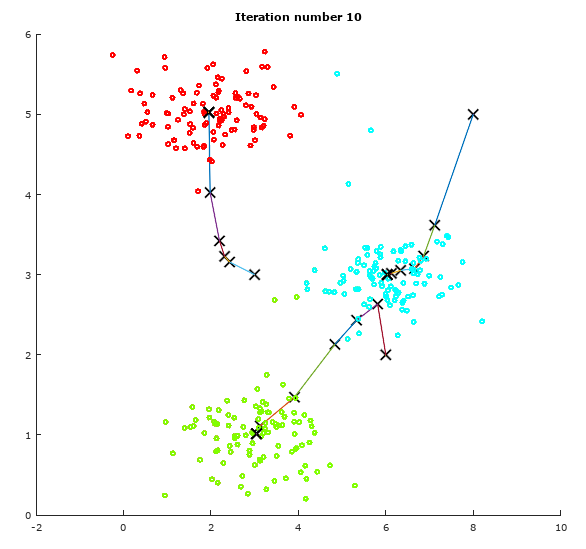
- can we distinguish between public and private universities - k-means.
- recommendation systems - model-based classifier (using SVD) and memory-based classifier (cosine similarity).
- SF salaries, e-commerce purchases, 911 calls - data analysis and visualization.
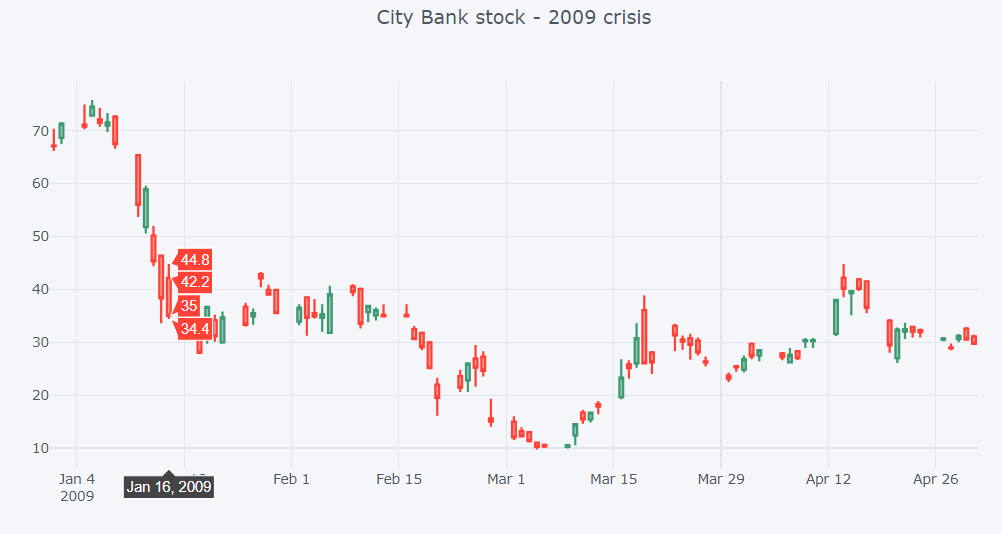
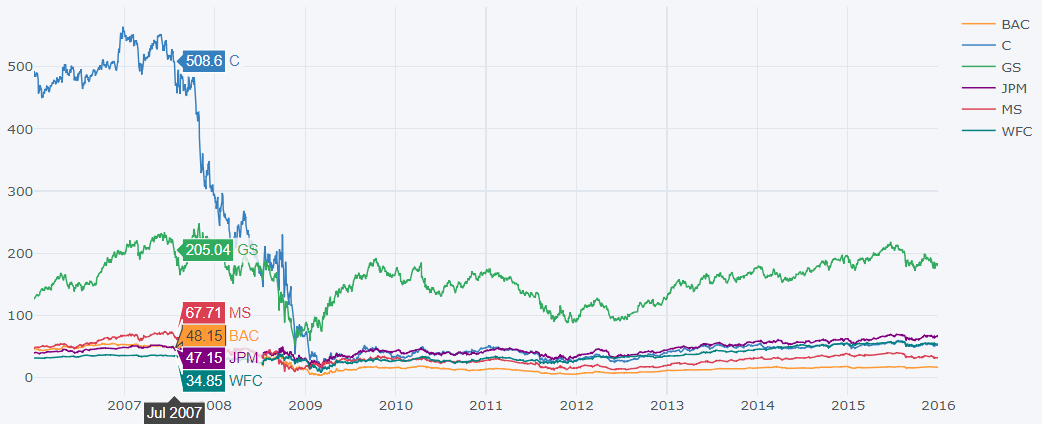
- retrieve live stock information and technical analysis.
Matlab. When I followed Andrew Ng's Stanford Machine Learning course, I did quite a few mini-projects that led me to write classic machine learning algorithms from first principle (algorithmics and matrix computations).
- digits recognition - neural networks (we wrote the forward and backpropagation algorithms ourselves).
- email spam classifier - simple natural language processing using stemming and bagging.
- house price prediction - linear regression.
- recommender systems for movie rating - collaborative filtering.
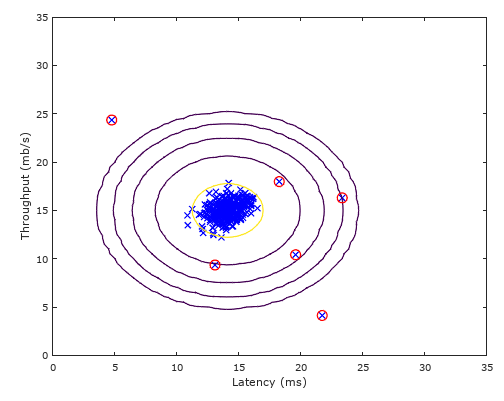
- anomaly detection to spot failing servers on a network - typical example of unsupervised learning, here using a simple multivariate gaussian kernel
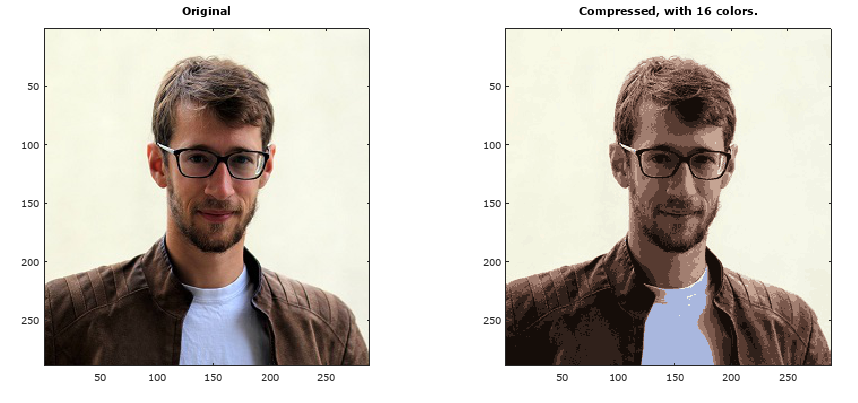
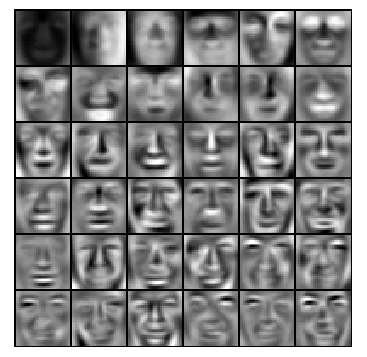
- image compression - K-means and PCA.
PySpark
- While I usually work with the AWS account of the company I work for (Redshift, S3, Mongo DB, SageMaker), I went through the process of opening my own AWS account, e.g. to play a bit with PySpark
- Originally I discovered Spark through DataCamp and Jose Portilla's intro courses. Mini-projects:
- Flight delays prediction. I got familiarized with PySpark SQL-like queries to filter, merge and transform data. I then built a Sklearn-like pipeline on a simple logistic regression based on airplane age, air time, airline and destination airport.
- Predicting click through rate, and how this example of dataset can benefit from online learning (continuous data set making a machine learning algorithm continuously adapt), and how non-online algorithms need to be adapted with stochastic gradient descent / mini-batch gradient descent, and parallelised using map reduce.