Skip to content
New issue

Have a question about this project? Sign up for a free GitHub account to open an issue and contact its maintainers and the community.

By clicking “Sign up for GitHub”, you agree to our terms of service and privacy statement. We’ll occasionally send you account related emails.

Already on GitHub? Sign in to your account

Question: debugging in pycharm (or other arbitrary IDE) #613

Closed
niko-dunixi opened this issue Jun 26, 2017 · 12 comments
Closed

Question: debugging in pycharm (or other arbitrary IDE) #613

niko-dunixi opened this issue Jun 26, 2017 · 12 comments

Comments

@niko-dunixi
Copy link

Hello, so quick question. I have locust installed in a venv on python 3 (locustio==0.8a2). I've been building and testing a locust python script, but I'm trying to traverse some complicated json responses. In order to run a locust script, you have to run locust loadtest-file.py

Is it possible to attach a debugger while running a locust script?

@cgoldberg
Copy link
Member

cgoldberg commented Jun 27, 2017

not really an answer, but a few comments:

Is it possible to attach a debugger while running a locust script?
I've been building and testing a locust python script, but

a locustfile is a normal python file, so you can debug it directly without the rest of the framework. It's easier to debug a single Locust than a swarm.

I'm trying to traverse some complicated json responses.

add code so your Locust class gets created when locustfile is run as a script (not imported) ... you can usually do most script development against a single instance of a Locust.

@MattF-NSIDC
Copy link

MattF-NSIDC commented Oct 20, 2017

Took me a minute to get there (specifically to realize I had to call .run()) so I figured I'd share:

I create a subclass of HttpLocust called WebsiteUser. To execute a single instance from the CLI, I added:

if __name__ == '__main__':
    x = WebsiteUser()
    x.run()

Then run python locustfily.py. If I have a pdb breakpoint in one of my tasks, this triggers the breakpoint. Full example locustfile.py:

from locust import HttpLocust, TaskSet, task

class UserBehavior(TaskSet):
    @task
    def index(self):
        import pdb; pdb.set_trace()
        self.client.get("/")

class WebsiteUser(HttpLocust):
    task_set = UserBehavior 
    host = 'http://google.com'
    min_wait = 1000
    max_wait = 2000

if __name__ == '__main__':
    WebsiteUser().run()

@GabLeRoux
Copy link

GabLeRoux commented Feb 2, 2018

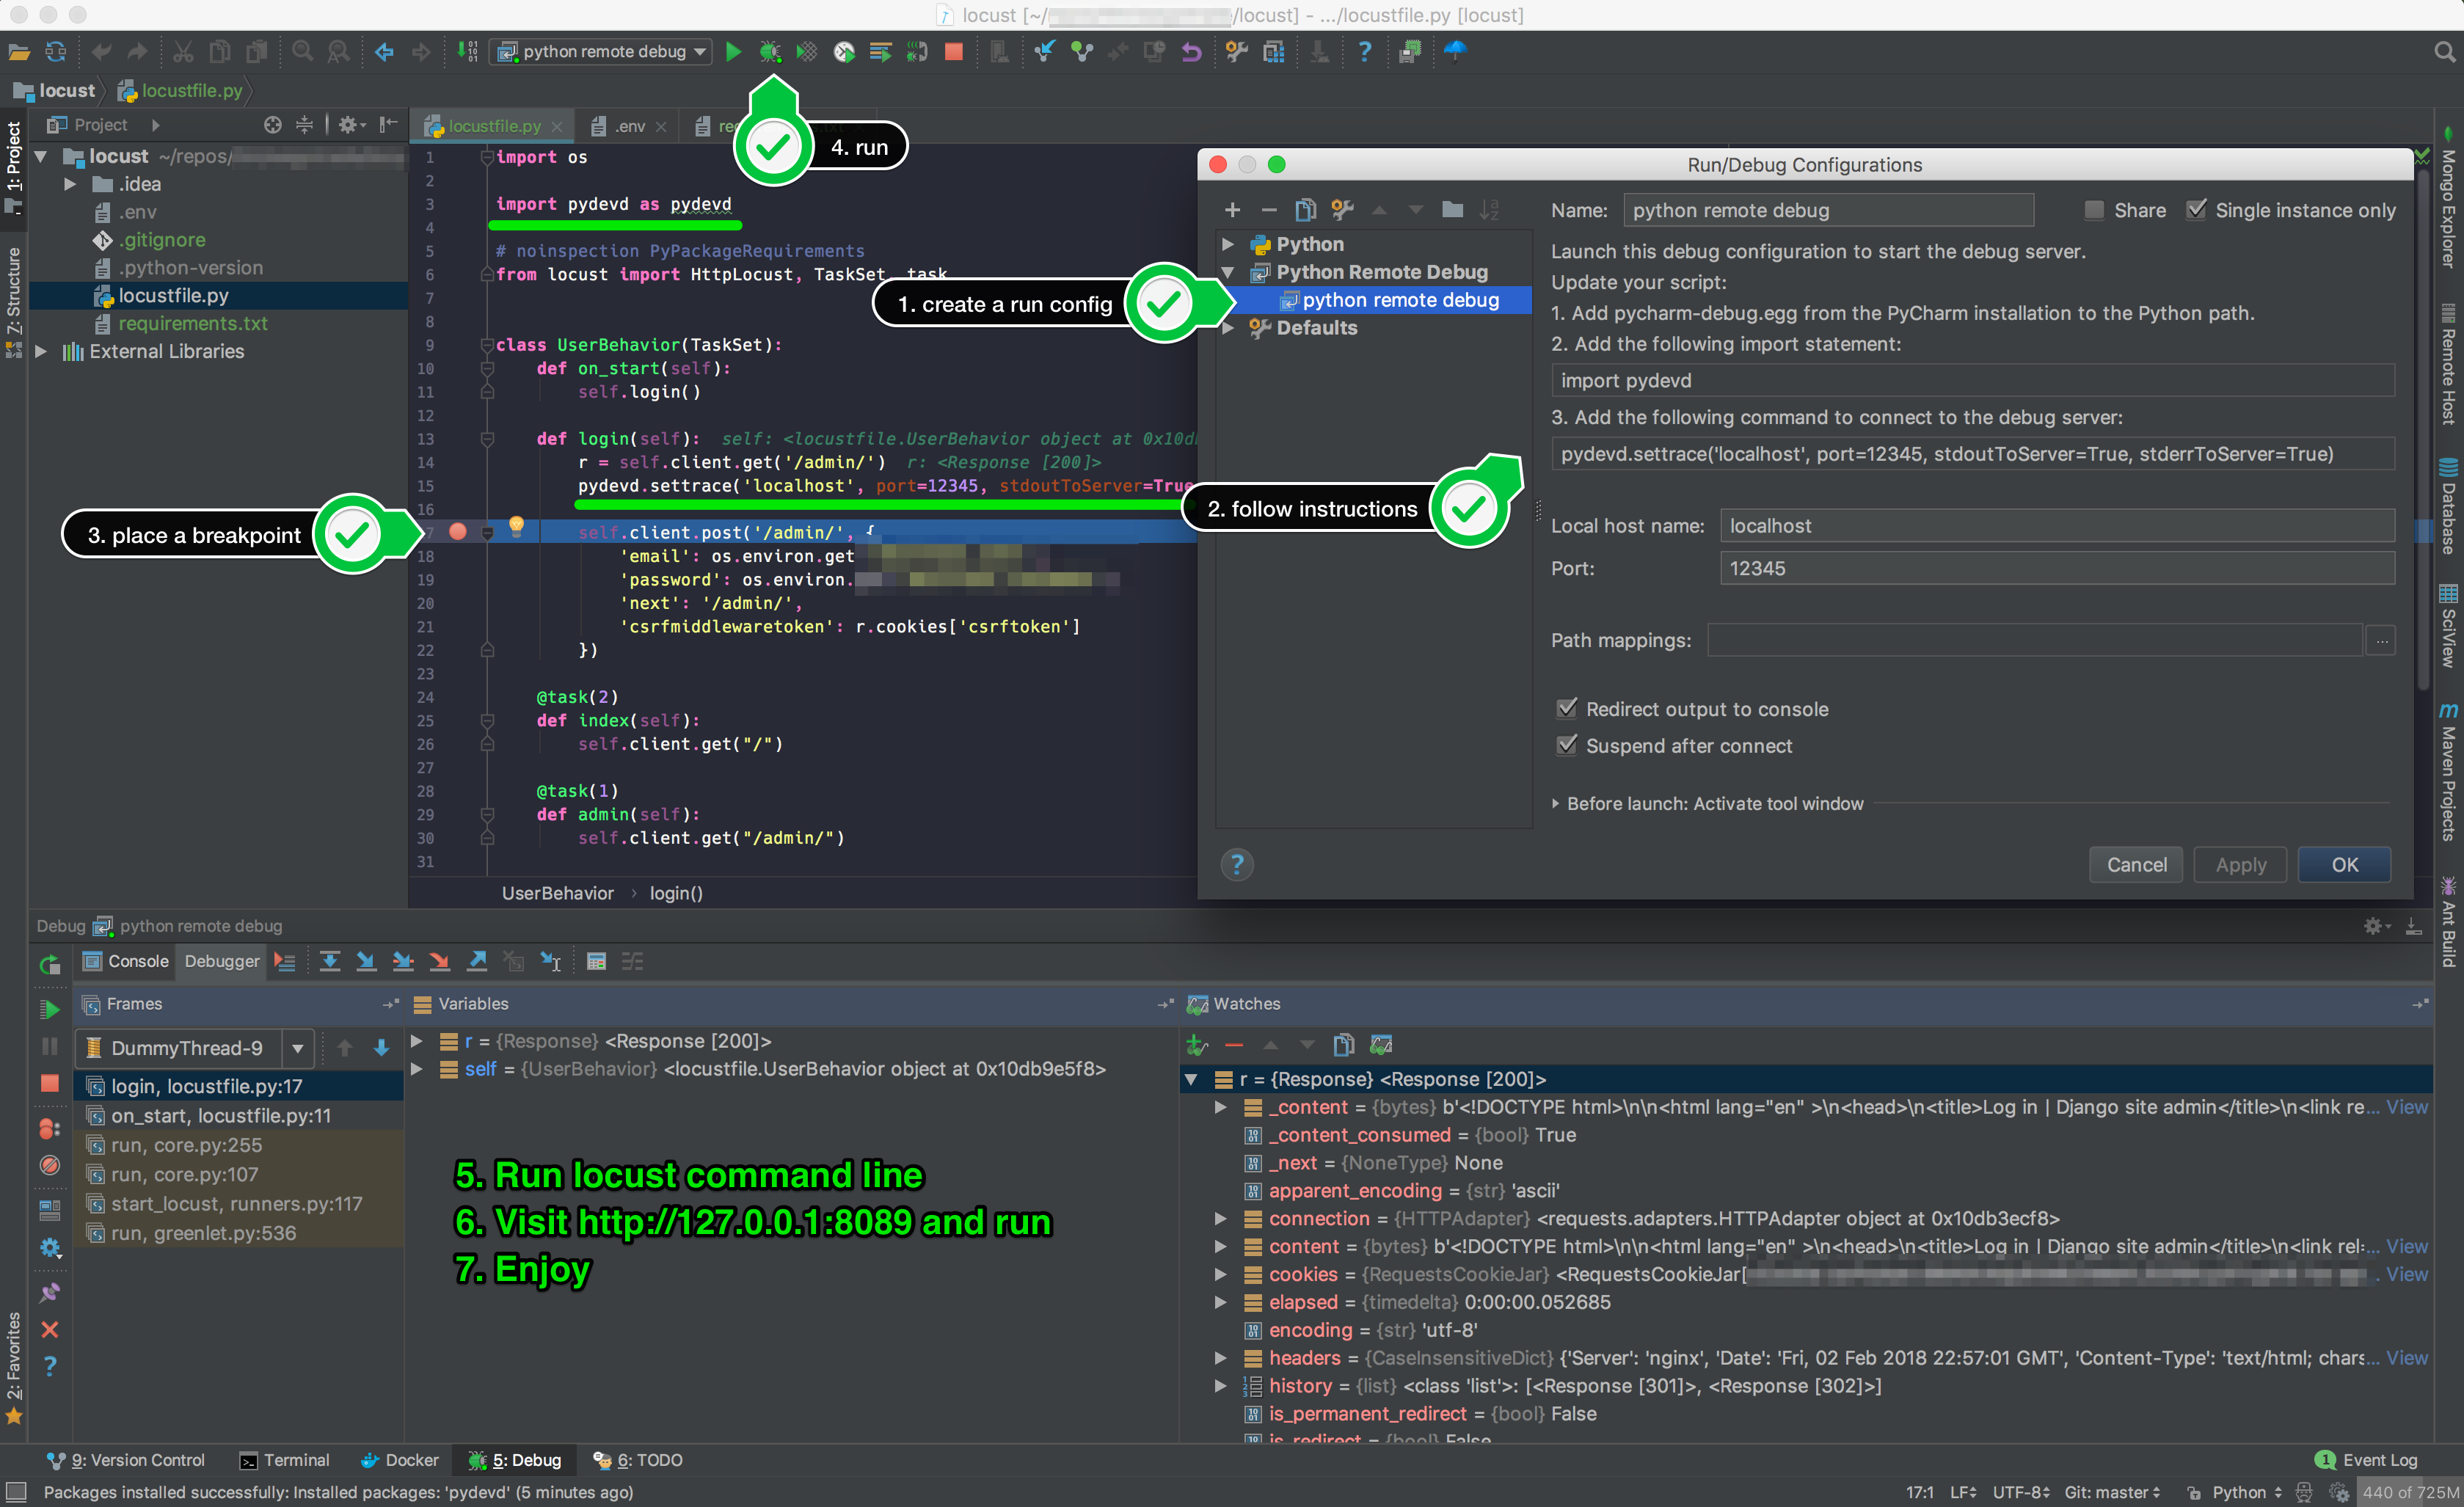
Here I managed to get Intellij Idea (Similar to PyCharm) to break while locust is running.

image

I used python remote debug run configuration, followed instructions. In my case, I just used a virtualenv and installed locustio and pydevd directly. 🎉

It should break automatically right under the following line (I think break point is optional):

pydevd.settrace('localhost', port=12345, stdoutToServer=True, stderrToServer=True)

👍

@nelsonjchen
Copy link

  1. Turn on the gevent compatible option in the debugger
  2. Run the locust executable as the script, (which locust)

This seems to work for me. Also, note that the remote debug suggestion above requires a paid version of PyCharm or its cousin of a plugin in IntelliJ. I think the steps I have above will work for PyCharm CE as well.

@ad34
Copy link

ad34 commented Nov 20, 2018

is there a similar tip for visual studio code ?

@dalegaspi
Copy link

just to add to what @nelsonjchen has stated, for IntelliJ set the "Script path" to what which locust returns from the command line then set the "Parameters" to -f script_you_want_to_debug.py --host http://whatever. you should be able hit breakpoints where you placed them in script_you_want_to_debug.py

@r3dlin3
Copy link

r3dlin3 commented Aug 7, 2020

@ad34

is there a similar tip for visual studio code ?

This is what I put in my .vscode\launch.json

{
    "version": "0.2.0",
    "configurations": [
        {
            "name": "Locust",
            "type": "python",
            "request": "launch",
            "module": "locust",
            "args": [
                "-f",
                "${file}",
            ],
            "gevent": true,
            "console": "integratedTerminal"
        }
    ]
}

You can parameters to the args array, if you want an headless experience, set user and hatche rate, the host, etc.

@ffedoroff
Copy link

Debug doesn't work in locust >= 1.2.3
To enable debug add env variable:
GEVENT_SUPPORT=True

@ffedoroff
Copy link

In locust-plugins you can find debug example:
https://github.com/SvenskaSpel/locust-plugins/blob/master/examples/debug_ex_advanced.py

@GugliEyes
Copy link

I use Eclipse with Pydev. In Preferences->PyDev->Debug the 2nd to last option is "Gevent compatible debugging?".

Gevent has to do with the lightweight threading used by Locust ( greenlets ) and I am too ignorant to know much more than that. Once I clicked that, I was able to stop at a breakpoint in my code.

Thanks to all who provided the information and the person who wrote the Single User locust-plugin.

@georgeevil
Copy link

I was able to develop, run and debug using the "Library" mode.
https://docs.locust.io/en/stable/use-as-lib.html#full-example (added this to bottom of my tests and modified them)
recent PyCharm config allows for a checkbox to enable Gevent compatible debugging
Screen Shot 2021-05-28 at 9 31 44 AM

@joquijada
Copy link

  1. Turn on the gevent compatible option in the debugger
  2. Run the locust executable as the script, (which locust)

This seems to work for me. Also, note that the remote debug suggestion above requires a paid version of PyCharm or its cousin of a plugin in IntelliJ. I think the steps I have above will work for PyCharm CE as well.

Thanks, worked like a charm. Before I enabled this setting, the debugger would seem to "hang" and would never reach a breakpoint. For all those interested this is where you can enable the gevent compatible option in the debugger in PyCharm,

image

Sign up for free to join this conversation on GitHub. Already have an account? Sign in to comment
Projects
None yet
Development

No branches or pull requests